
At 9 a.m., merchandising pulls stock from Shopify and finance pulls it from the ERP, and 564 of 571 SKUs disagree. Nobody has lost 11,000 units. Inventory reconciliation is the check that recorded stock matches the goods really there, across every system that records it. Between two systems, that only works once both count the same SKU, in the same unit, in the same state, at the same moment. Shopify alone splits on hand stock into available, committed and unavailable units [1].
We tested that on illustrative synthetic data with 14 real losses planted among 600 SKUs. Compared as reported, Shopify against the ERP flagged 564 SKUs, 13 of them real. With keys, units, states and cut-off aligned, the comparison flagged exactly the 14 SKUs with real losses and nothing else.
Figures checked 16 November 2026. This guide is for retail data, finance and operations teams who own stock reporting across an online store, a warehouse and an ERP. For the general case of two systems disagreeing on one number, read DataFuseAI's post on multi-source data conflicts.
Key Takeaways
- Most mismatches are definitions, not missing stock. In our test, 551 of 564 naive mismatches had no real loss behind them.
- Cut-off is the biggest cause. Without rolling both snapshots to the same moment, 558 SKUs were falsely flagged.
- Shopify's "Available" is not on hand. Available excludes committed and unavailable units; comparing it to an ERP on-hand figure created 488 false alarms.
- Cases against eaches look like huge losses. Without unit conversion, 43 SKUs were falsely flagged, together 4,298 units apart.
- SKU format differences hide real problems. 29 SKUs never joined, and one real loss went unseen.
Why don't inventory numbers match across systems?
Inventory numbers rarely match because each system counts a different quantity at a different time. Shopify reports units in several states, a warehouse system reports what is physically on its shelves now, and an ERP often reports a posted balance from its last batch. Comparing them as reported mixes four separate differences.
| Difference | What happens | Example in our data |
|---|---|---|
| Key | The same item has differently formatted codes, so rows don't join | BG-GRN-S026 in the ERP, BGGRNS026 in Shopify |
| Unit | One system counts cases, another counts single units | 27 cases of 6 plus 1 loose unit = 163 units |
| State | One figure excludes units that are committed or set aside | Shopify available 159; on hand 161 |
| Cut-off | Snapshots are taken at different times | ERP posted at 02:00; Shopify synced at 08:30 |
Source: DataFuseAI test on illustrative synthetic inventory, 16 November 2026. SKU codes are synthetic.
The state difference comes straight from Shopify's own definitions. On hand inventory is the total of Committed, Unavailable and Available, and Available is what you can sell [1]. Unavailable covers units set aside by apps or held for other reasons, such as damaged, quality control or safety stock [1].
Shopify's developer documentation adds the order flow. When an order is placed, Shopify decrements available and increments committed; once the order is fulfilled, it decrements committed [2]. Changes to committed, reserved, damaged, safety stock and quality control don't trigger webhooks, so an integration that relies only on webhooks won't hear about them [2].
How we tested
We generated one warehouse's stock for 600 SKUs with a fixed seed and took three snapshots at 09:00: the ERP, the warehouse system and Shopify. Every difference was planted, so we know which mismatches are real and which are artefacts of comparison. Nothing in it is customer data.
- ERP: a nightly batch posted at 02:00. 44 SKUs are kept in cases of 6 or 12, with any remainder as loose units, and 14 SKUs carry between 1 and 5 units more than physically exist, 57 in total. These are the real losses.
- Warehouse system: physical units at 09:00, after the picks, shipments and receipts since 02:00. 572 SKUs moved in that window.
- Shopify: on hand from a sync at 08:30, split into available, committed and unavailable. 30 SKUs received stock after the sync, and 29 have their codes written without hyphens.
The Methodology section lists the limits of this setup.
Which misalignment causes the most false alarms?
The cut-off causes the most false alarms, then the state. We applied every alignment except one and counted SKUs flagged with no real loss behind them. Without the cut-off alignment, 558 SKUs were falsely flagged; without the state alignment, 488; without unit conversion, 43.
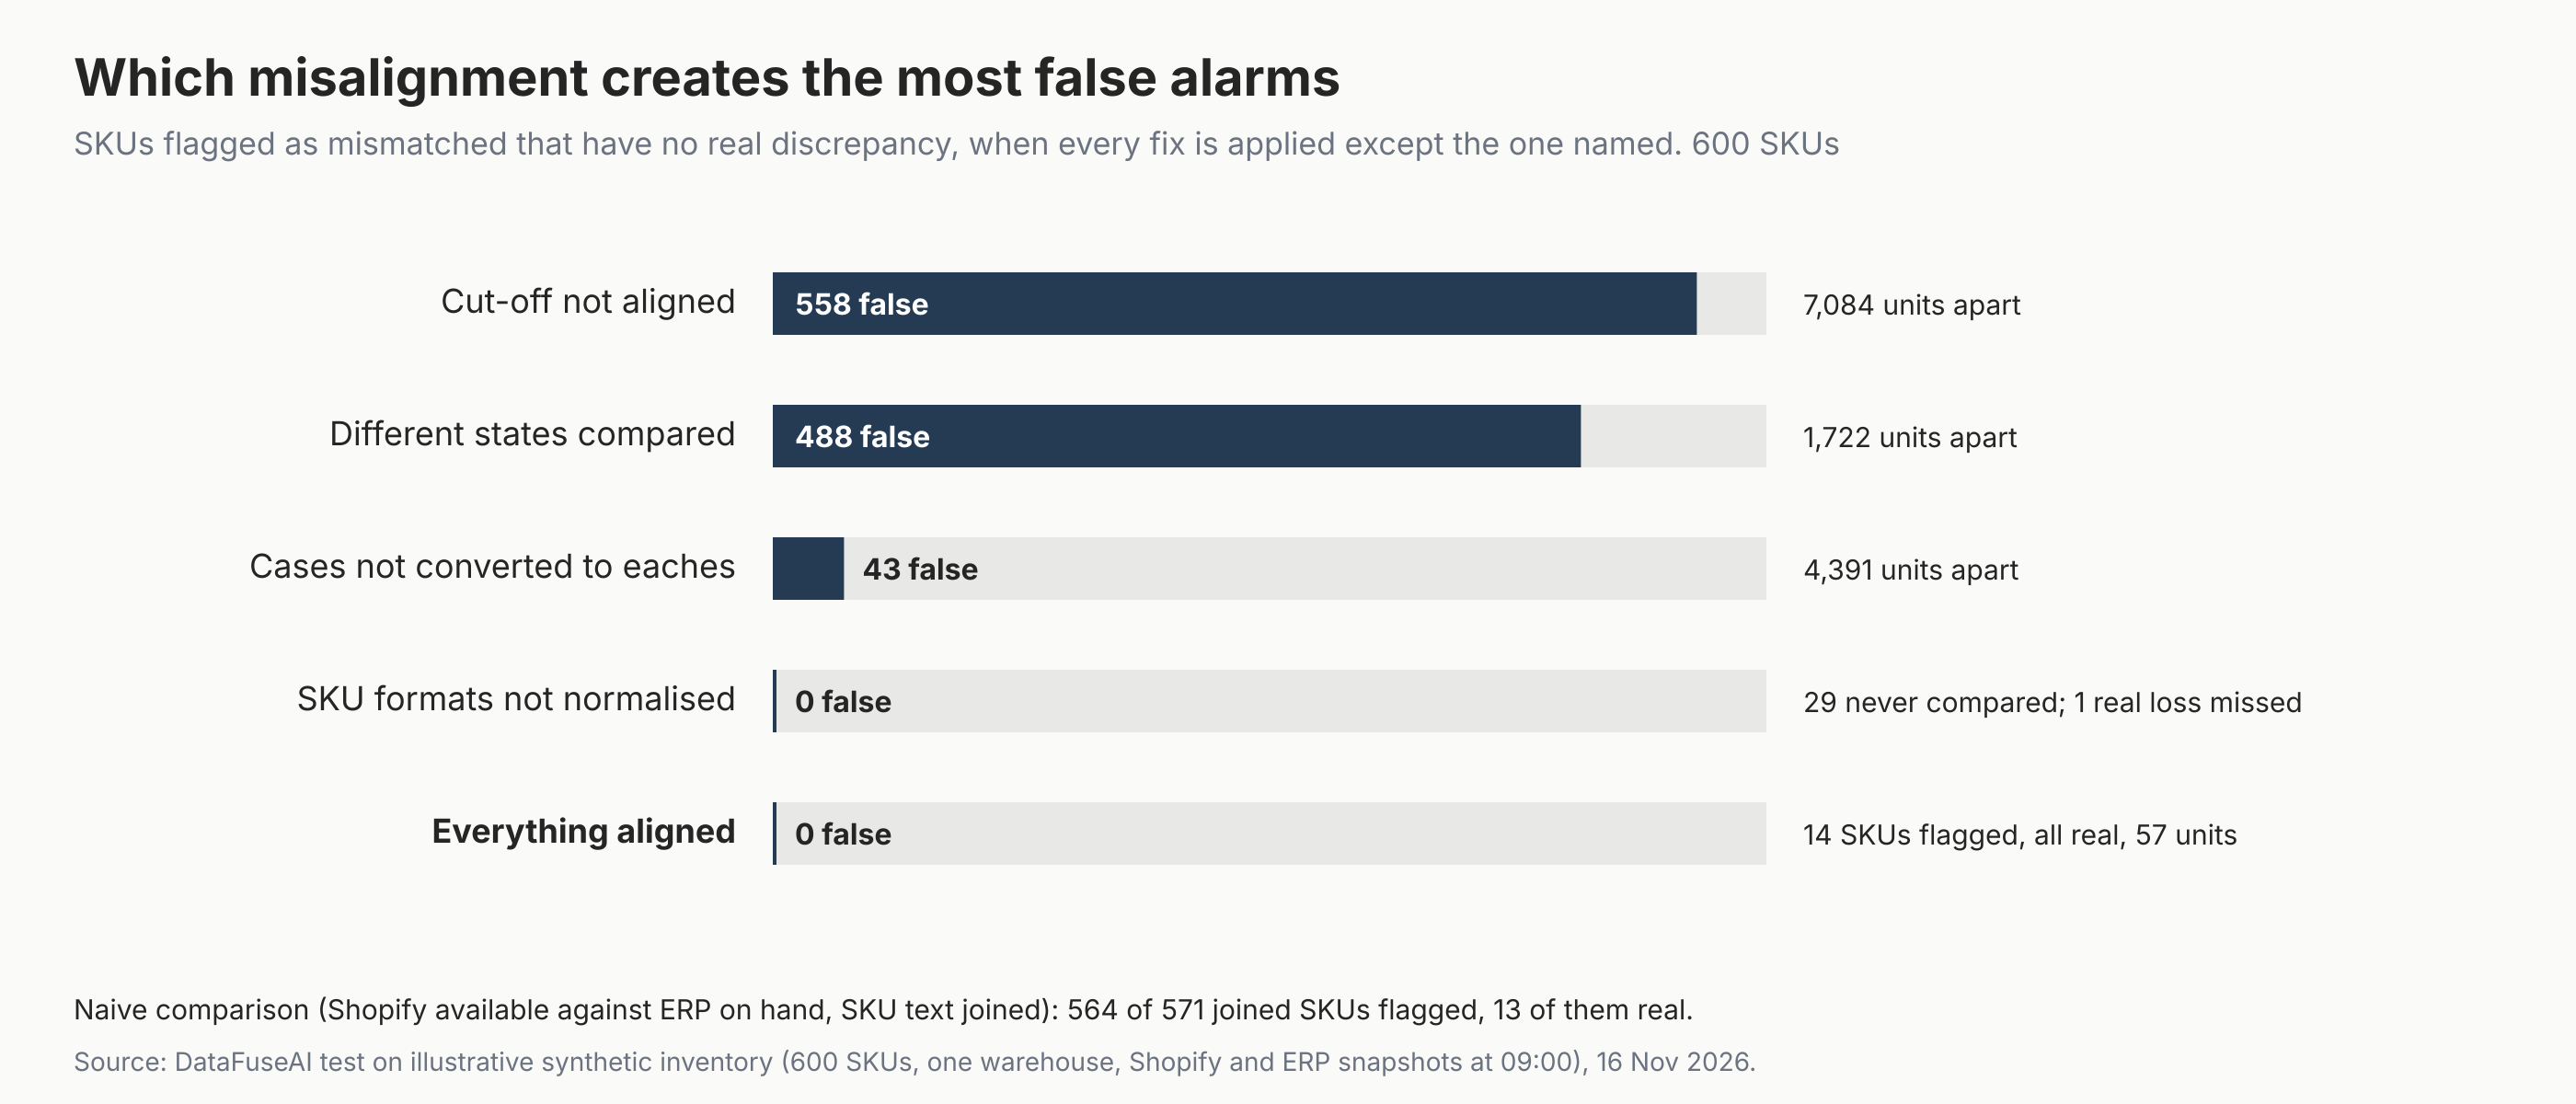
| Alignment left out | SKUs falsely flagged | Units apart in total | Real losses found (of 14) |
|---|---|---|---|
| Cut-off | 558 | 7,084 | 14 |
| State | 488 | 1,722 | 14 |
| Unit | 43 | 4,391 | 14 |
| Key | 0 (29 SKUs never compared) | 53 | 13 |
| None: all four aligned | 0 | 57 | 14 |
Units apart totals every flagged SKU, real losses included. Source: DataFuseAI test on illustrative synthetic inventory, 16 November 2026.
The unit row shows why counts of flagged SKUs and units tell different stories. Only 43 SKUs were wrongly flagged without the unit conversion, but together they were 4,298 units apart, because a case count is a sixth or a twelfth of the unit count. A report ranked by units would put those SKUs at the top of the investigation list.
The key row fails the other way. Unjoined SKUs raise no alarm at all, so the comparison looks cleaner than it is. One of the 29 hid a real loss of 4 units.
How can one SKU show 159 units and 27 at the same time?
One SKU can show 159 units in Shopify and 27 in the ERP when the two figures differ in unit, state and cut-off at once. SKU CP-NVY-S204 from the test shows all of them. Compared as reported, the gap is 132 units; compared like for like, it does not exist.
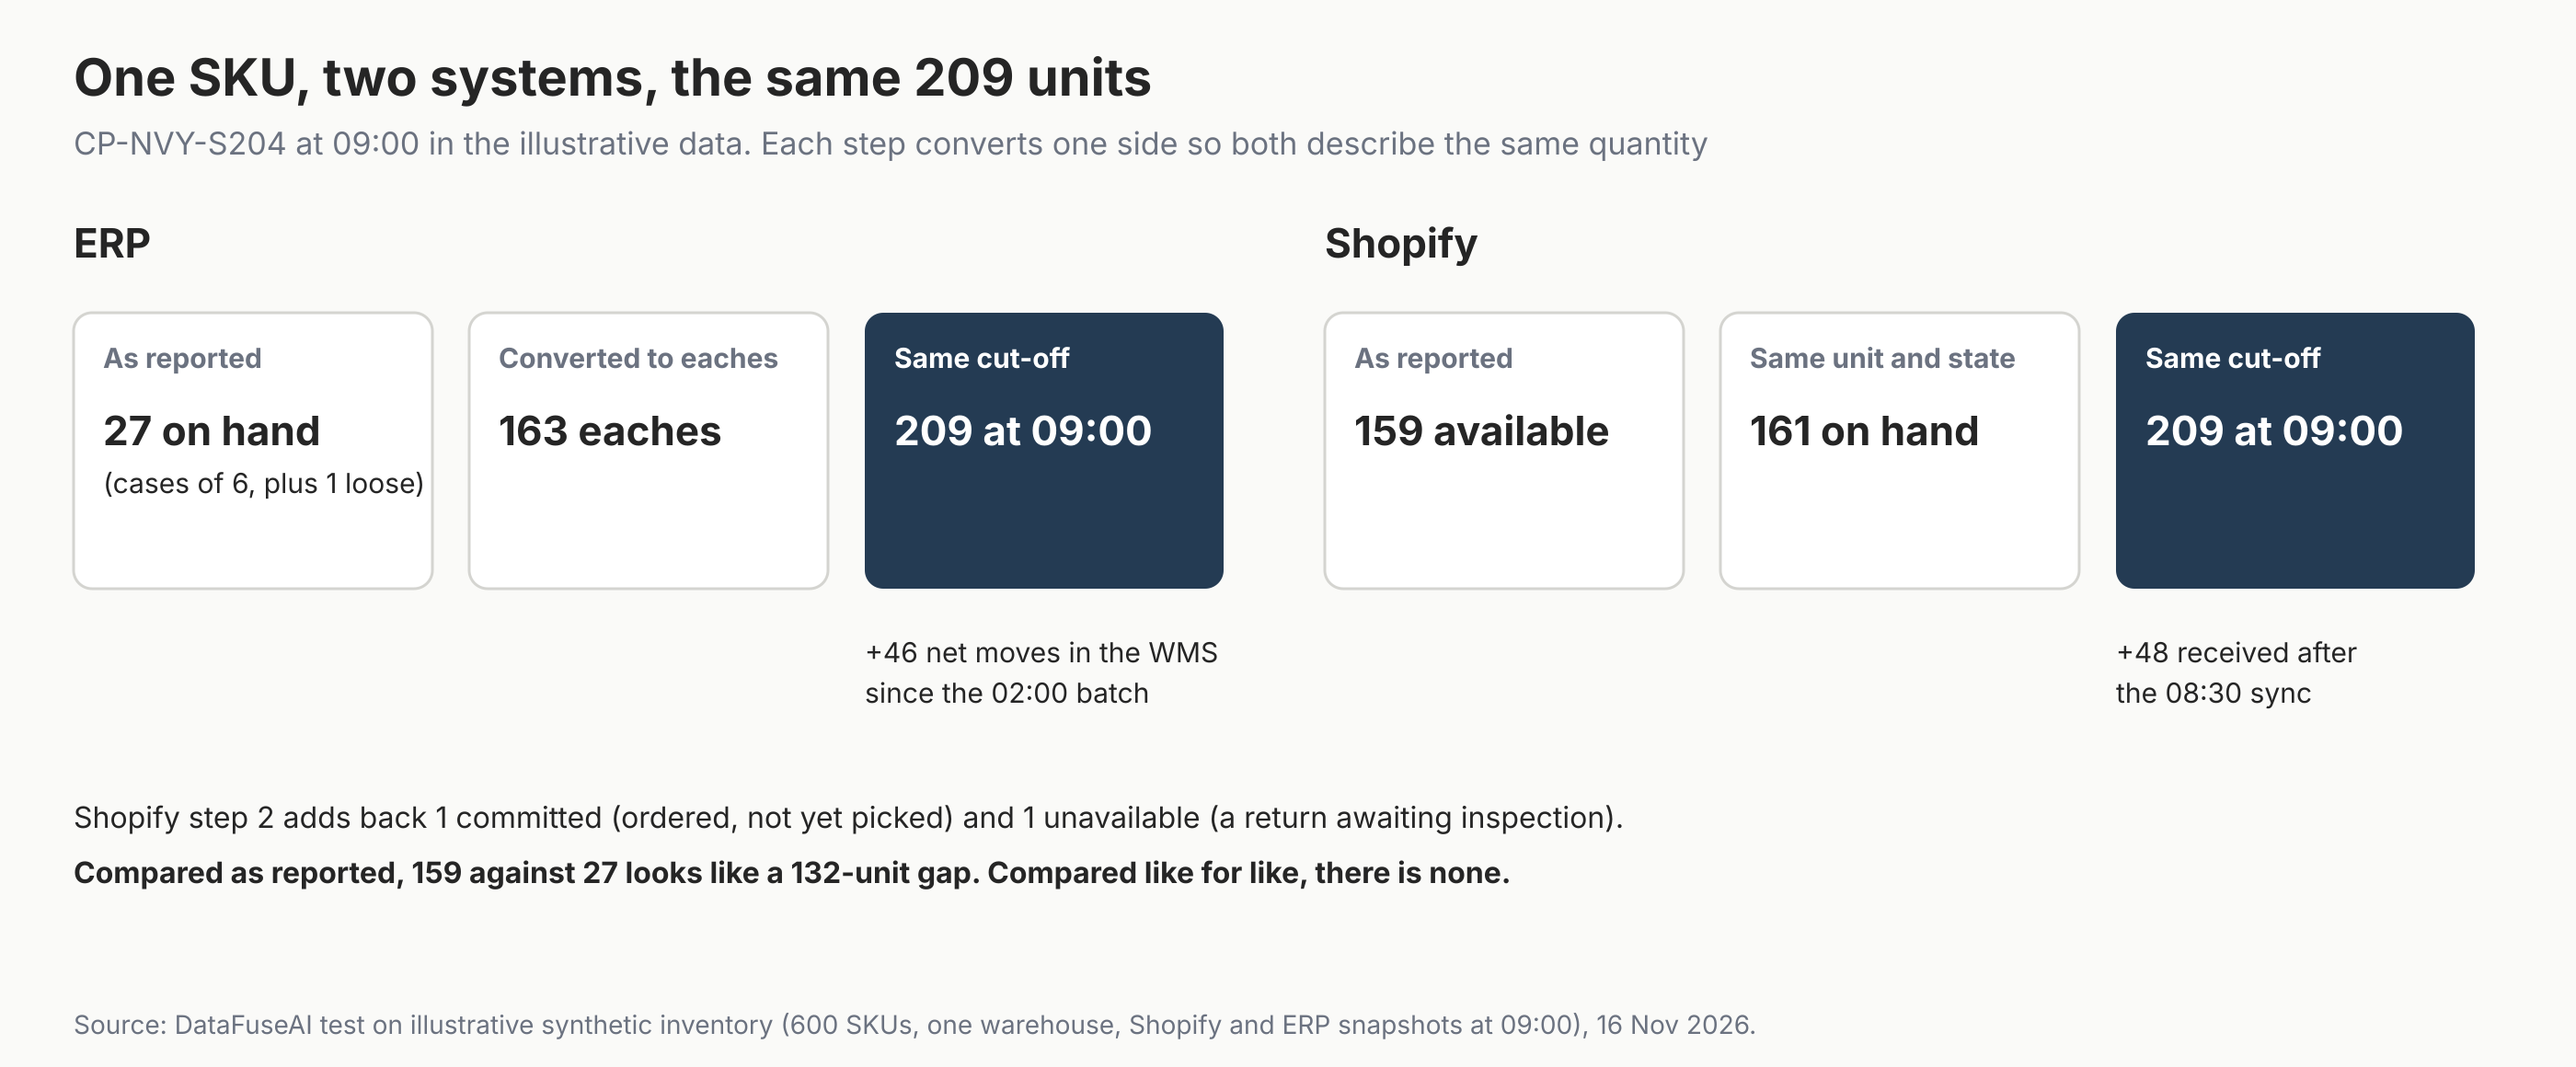
- Unit. The ERP's 27 cases of 6 plus 1 loose unit are 163 units.
- State. Shopify's 159 available plus 1 committed and 1 unavailable is 161 on hand.
- Cut-off. The warehouse logged 46 net units in since the ERP's 02:00 batch, so the ERP figure rolls forward to 209. Shopify missed 48 units received after its 08:30 sync, which also gives 209.
Both systems were right about what they measured. A real loss looks different: for BT-BLK-XL294, Shopify's on hand of 35 and the ERP's 40 had no movements, packs or sync gaps between them. Those 5 units are gone.
Four alignments before you compare inventory
Four alignments before you compare is a DataFuseAI editorial framework, not an industry standard. Run all four, in any order, before treating a difference as a discrepancy; what remains after them is the list worth sending to the warehouse for a count.
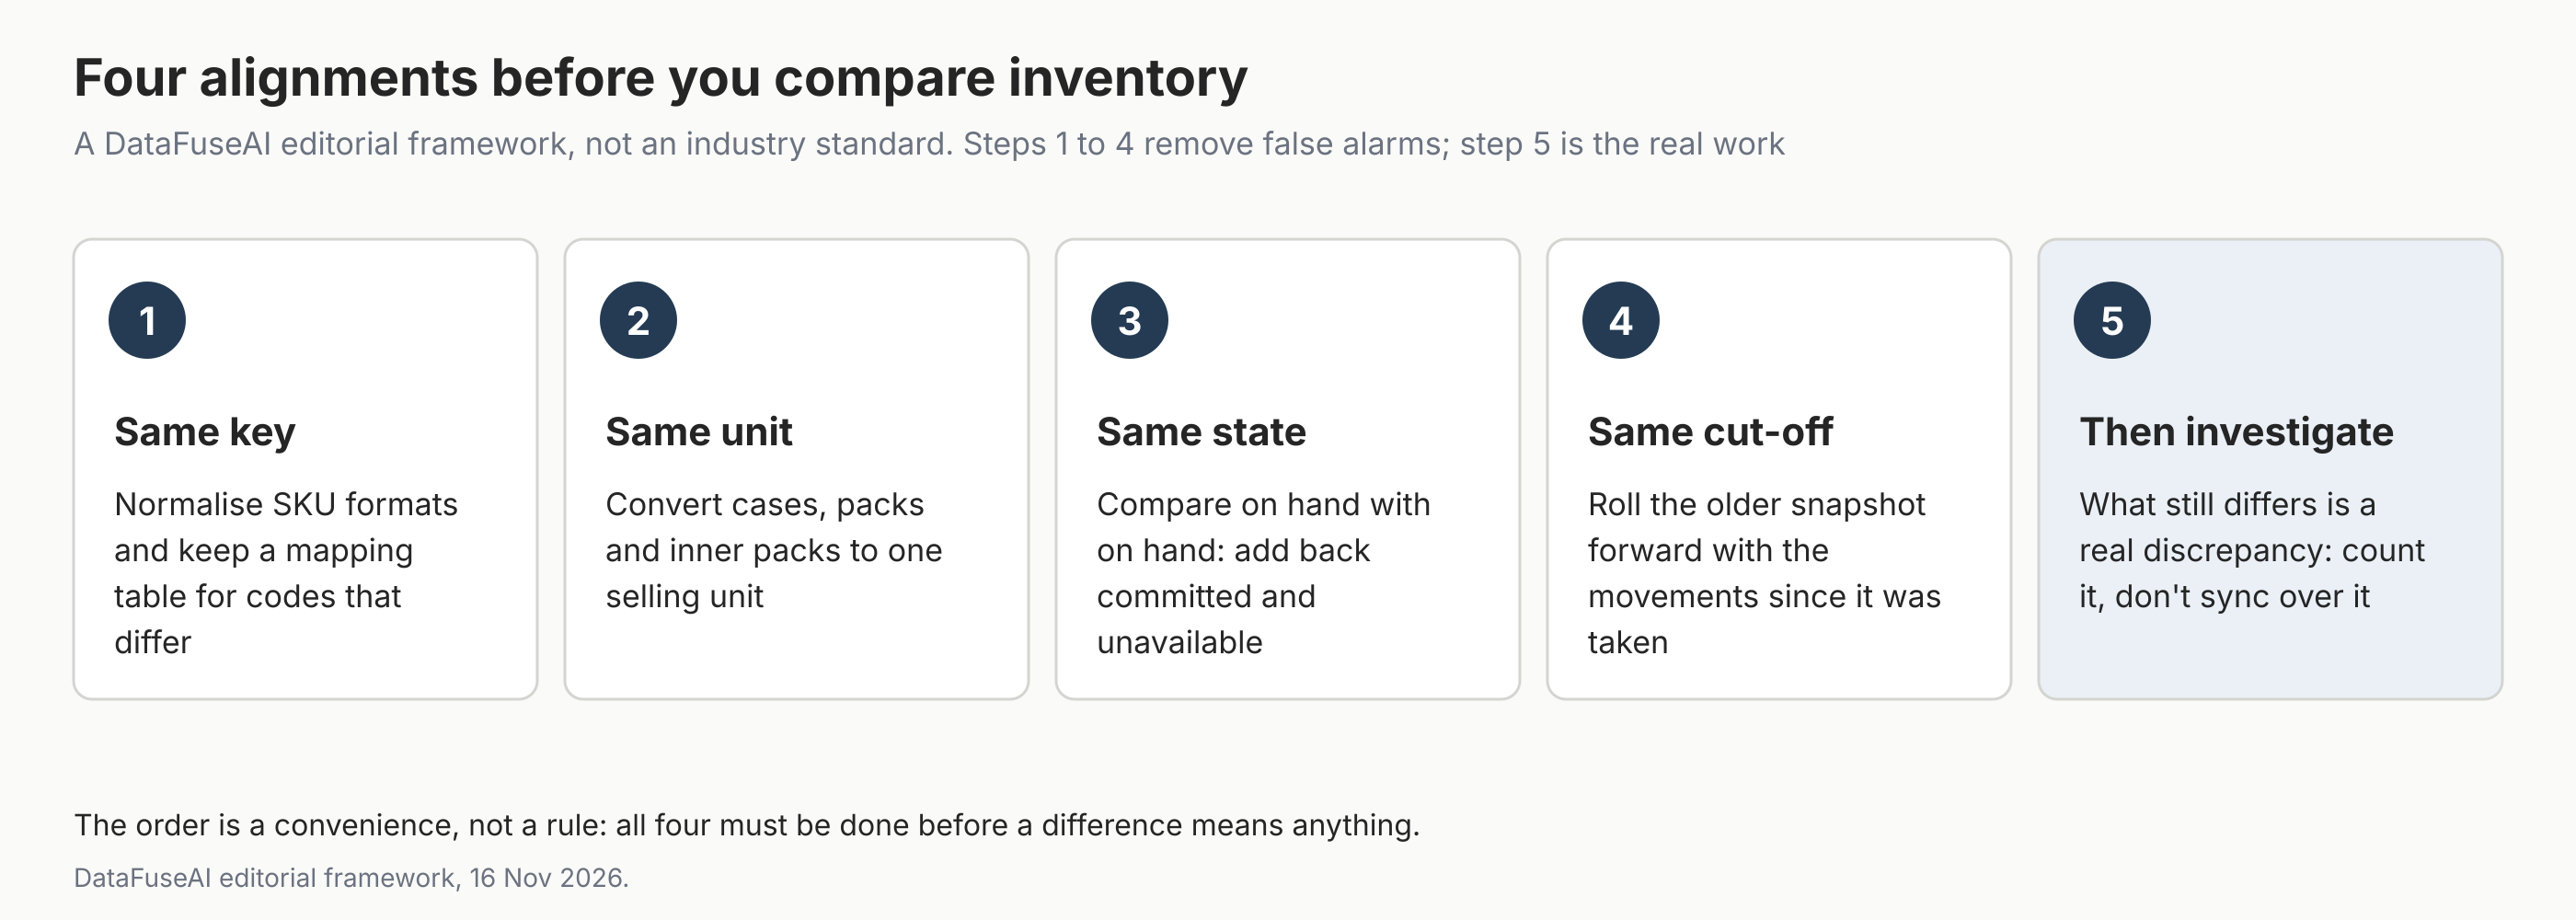
- Same key. Normalise case, spaces and punctuation in SKU codes, then keep a mapping table for codes that differ in substance. Report unjoined rows as a count, because a missing join hides problems rather than raising them.
- Same unit. Convert cases, packs and inner packs to one selling unit using the item master's pack sizes. In our data, 36 of the 44 case-counted SKUs also carried loose units.
- Same state. Compare on hand with on hand. For Shopify, that is available plus committed plus unavailable [1]; incoming stock is not on hand at all [2].
- Same cut-off. Pick one moment, then roll the older snapshot forward with the movements logged since it was taken. The warehouse movement log is usually the source for that.
- Then investigate. Whatever still differs needs a count, not a sync. Count the flagged SKUs on the shelf, find the cause, and post the adjustment in the system of record. Pushing one system's figure over the other erases the evidence of a loss.
Mistakes to avoid
- Syncing the ERP figure over Shopify to make them agree. It hides the 57 units of real loss instead of finding them.
- Comparing Shopify's Available with an ERP on-hand balance. Available excludes committed and unavailable units by definition.
- Reconciling straight after a batch with no movement log. Without the movements since the batch, nearly every active SKU looks wrong.
- Ranking problems by units without checking pack sizes. Case-counted items jump to the top for no reason.
- Ignoring rows that don't join. In our data, 29 SKUs disappeared from the comparison, along with one real loss.
Where DataFuseAI fits (and where it doesn't)
DataFuseAI can build the aligned comparison as a scheduled pipeline over the systems you already run. Its retail industry page says the hard part is agreeing what a store or a SKU is across systems, and that DataFuseAI unifies per-location count data while your inventory systems keep managing the stock [3].
That page's walkthrough, on demo data, unions two sales sources and pivots revenue by category on a nightly schedule [3]. Jobs can also run hourly or daily, and each run's status and execution log are kept, per the pipeline automation page [4].
What it does not do matters here. The retail page says DataFuseAI does not manage inventory, does not replace anything in your retail stack and does not decide data conflicts: a pipeline applies the precedence rule you define [3]. None of the DataFuseAI pages we read describes a Shopify connector or reading Shopify's inventory states. Check that with the team before relying on it.
To try the four alignments on one recurring stock report, DataFuseAI's free 30-day POC asks for one recurring workflow and two or three data sources [5]. Applications are reviewed for fit, there is no POC fee or obligation, and external cloud or compute costs, if any, stay with you [5].
Frequently Asked Questions
Why is Shopify's inventory lower than my ERP's?
Often because Shopify's Available figure excludes units committed to unfulfilled orders and units set aside as unavailable, while an ERP shows on hand [1]. A sync that runs on a schedule adds a timing gap on top. Compare Shopify's on hand with the ERP's on hand at the same moment before treating the gap as missing stock.
How often should I reconcile inventory between systems?
Reconcile at least as often as your slowest system posts, and always against a single cut-off moment. If the ERP posts nightly, a daily comparison rolled forward with warehouse movements removed every false alarm in our test. Real stock will leave some noise, so expect a short list to count. Fast-moving or high-value SKUs may need checking more often, which is an operational choice rather than a fixed rule.
What counts as a real inventory discrepancy?
A real discrepancy is a difference that survives aligning SKU keys, units, inventory states and the cut-off time. In our test, 14 SKUs survived, and all 14 were the planted losses. A real discrepancy needs a physical count to explain it, such as damage, theft, a mis-pick or a receiving error.
Will a real-time sync fix inventory mismatches?
A faster sync shrinks the cut-off gap, which was the largest cause in our test, but it does not fix keys, units or states. Pipe17, which sells an alternative to the standard setup, says the default Shopify and NetSuite connector typically pushes counts every 15 to 30 minutes, without citing a source [6]. Unit and state differences remain whatever the sync speed.
Methodology
Data. Synthetic and illustrative, generated in Python with a fixed seed: 600 SKUs in one warehouse. Physical stock at the 02:00 ERP batch is drawn at random; picks and shipments between 02:00 and 09:00 affect most SKUs. Each SKU had a one-in-three chance of a receipt of 24 or 48 units, and each receipt a 15% chance of landing after Shopify's 08:30 sync; 30 did. The seed is 20261211.
Planted differences. 29 Shopify SKU codes lack hyphens, and 44 ERP items count in cases of 6 or 12 with any remainder kept as loose units. Committed (0 to 5) and unavailable (0 to 2) units sit inside Shopify's on hand. 14 SKUs carry 1 to 5 units more in the ERP than physically exist. Shopify's states follow its documented definitions [1].
Measures. A SKU is flagged when the two figures differ after the alignments applied. "Falsely flagged" means flagged with no planted loss. Leave-one-out runs apply every alignment except the one named. Scripts ran on 16 November 2026, between 18:23 and 18:25 UTC.
Limits. Real stock has several locations, transfers, bundles, returns in transit and cycle-count adjustments that this test leaves out. The counts show how each misalignment behaves, not how often it occurs in any business. Because every difference was planted and the alignments model them exactly, a clean result after alignment is expected by construction. The test shows what each misalignment costs, not that real stock reconciles this cleanly. It measures a comparison method, not any product.
References
- Shopify. "Inventory states." Shopify Help Center. Accessed 16 November 2026. https://help.shopify.com/en/manual/products/inventory/managing-inventory-quantities/inventory-states
- Shopify. "Apps in inventory management." Shopify developer documentation. Accessed 16 November 2026. https://shopify.dev/docs/apps/build/orders-fulfillment/inventory-management-apps
- DataFuseAI. "Retail Data Integration for Store and Marketplace Teams." Accessed 16 November 2026. https://www.datafuseai.com/industries/retail-ecommerce
- DataFuseAI. "Data Pipeline Automation, Scheduling & Monitoring." Accessed 16 November 2026. https://www.datafuseai.com/solutions/data-pipeline-automation
- DataFuseAI. "Free 30-Day Data Integration POC." Accessed 16 November 2026. https://www.datafuseai.com/free-poc
- Pipe17 Editorial. "Shopify + NetSuite Inventory Sync: Why the Standard Setup Falls Short." 5 May 2026, updated 11 November 2026. Accessed 16 November 2026. https://pipe17.com/blog/shopify-netsuite-inventory-sync/

 Request a Demo