
Your carrier scorecard says Carrier A delivers on time 89.6% of the time and Carrier B 82.1%. Next quarter's volume moves to A. Shipment data here means what you shipped, when you promised it, and when each carrier says it was delivered. Bringing it together means joining carrier tracking events to your own shipments on one key, one delivery event, one clock and one unit. Until then, a ranking can be upside down: in our test, aligned data put B ahead of A.
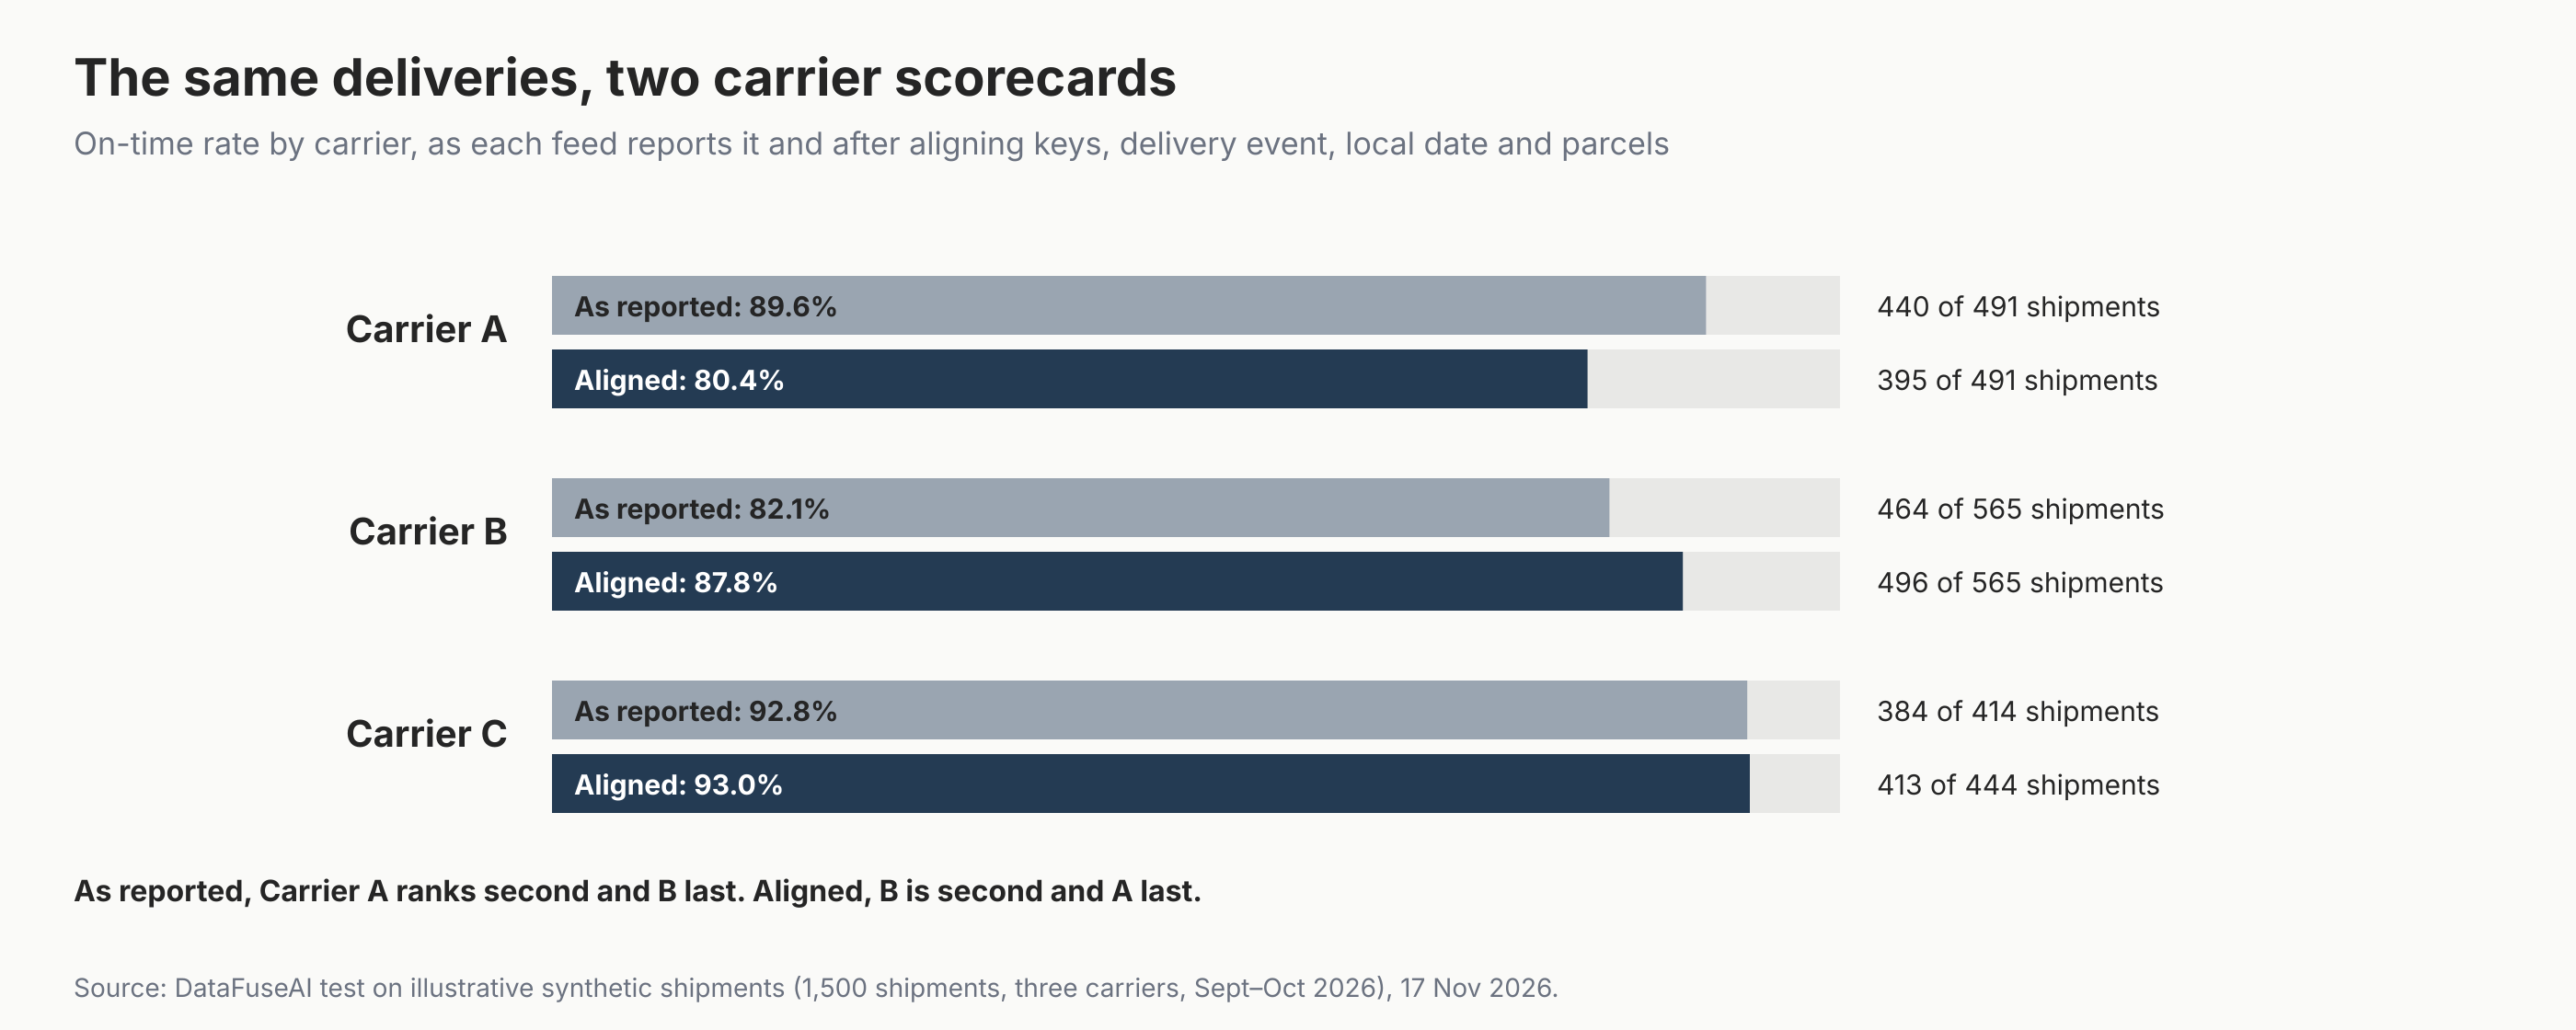
We tested that on illustrative synthetic data: 1,500 shipments across three carriers, each reporting delivery in a different shape. One sent EDI 214 events in local time, one an API feed in UTC per parcel, and one a weekly file. Aligned, the on-time rates were 80.4% for A, 87.8% for B and 93.0% for C.
Figures checked 17 November 2026. This guide is for logistics, transport and data teams who build carrier scorecards from a TMS and several carrier feeds. For the general case of two systems disagreeing on one value, read DataFuseAI's post on multi-source data conflicts.
Key Takeaways
- Rankings can flip. In our test, as reported, Carrier A ranked second and B last; aligned, B was second and A last.
- Arrival is not delivery. Counting EDI arrival (X1) instead of completed unloading (D1) made 45 late shipments look on time.
- UTC dates can make late-evening deliveries look late. Reading Carrier B's UTC timestamps as dates made 66 on-time shipments look late.
- A shipment is delivered when its last parcel is. Scoring the first parcel made 10 late shipments look on time.
- Broken joins hide in the denominator. Dropped leading zeros removed 30 of Carrier C's shipments from its score without any warning.
Why don't carrier on-time rates compare?
Carrier on-time rates don't compare because each feed answers "when was it delivered?" differently. The difference sits in four places: the reference number, the event that counts as delivery, the clock the time is written in, and whether a shipment or a parcel is being scored.
| Difference | What happens | Example in our data |
|---|---|---|
| Key | The carrier's reference doesn't match the TMS text | PRO 07400518 in the TMS, 7400518 in the weekly file |
| Event | Arrival and completed delivery are separate events | EDI 214 X1 at 20:21, D1 at 09:21 next day |
| Clock | Timestamps are local in one feed and UTC in another | 19:38 in Chicago is 00:38 UTC the next day |
| Unit | One shipment has several parcels, each with its own delivery | 215 Carrier B shipments had two or three parcels |
Source: DataFuseAI test on illustrative synthetic shipments, 17 November 2026. References are synthetic.
The event difference is built into EDI. In the X12 214 status message, ArcBest's specification lists X1 as "Arrived at delivery location" and D1 as "Completed unloading at delivery location" [1]. Stedi's X12 reference notes that when the time code element is absent, the time represents local time of the status [2].
The on-time definition is not settled either. A Trading Partner Alliance and McKinsey survey of 24 North American consumer-goods retailers and manufacturers found no consensus on the window that counts as on time [3]. It also asked whether on time means the date the retailer requested or the date the manufacturer promised [3].
How we tested
We generated one shipper's data in Python with a fixed seed. A TMS held 1,500 shipments shipped between 1 September and 20 October 2026, each with a carrier reference, a destination state and a promised delivery date. Destinations were in New York, Illinois, Colorado and California.
The carriers reported delivery differently, on purpose. Carrier A sent EDI 214 X1 and D1 events with dates and times in local time. Carrier B sent one UTC timestamp per parcel. Carrier C sent a weekly file with local times and no zone, in which 30 of the 53 PRO numbers starting with zero lost that zero.
Because the data is synthetic, each shipment's true local delivery time is known. We scored on-time as delivered on or before the promised date, by local date, at completed unloading. We then scored the feeds as reported, fully aligned, and with each alignment left out.
Which carrier is on time once the data is aligned?
In our synthetic test, Carrier C was most on time at 93.0%, then B at 87.8% and A at 80.4%. As reported, the order was C, A, B, so A and B swapped places. The aligned figures match the true delivery times exactly, because every difference in this test was planted.
| Carrier | Feed | As reported | Aligned | Shipments scored, as reported |
|---|---|---|---|---|
| A | EDI 214, local time | 89.6% | 80.4% | 491 of 491 |
| B | API, UTC, per parcel | 82.1% | 87.8% | 565 of 565 |
| C | Weekly file, local time | 92.8% | 93.0% | 414 of 444 |
Source: DataFuseAI test on illustrative synthetic shipments, 17 November 2026.
Carrier B's two errors pull in opposite directions. Reading UTC dates pushed it down, and scoring the first parcel pushed it up, so its reported rate sits between the two. The effects don't simply add: together they cost B 5.7 points, not 9.9, because an earlier first parcel can escape the UTC date change. Netting errors like this make a wrong scorecard look plausible.
What does each misalignment do on its own?
Three of the four misalignments moved a carrier's rate in a predictable direction; the fourth depends on which shipments fail to join. We applied every alignment except one and compared the result with the fully aligned rate. The UTC date did the most damage, then arrival counted as delivery.
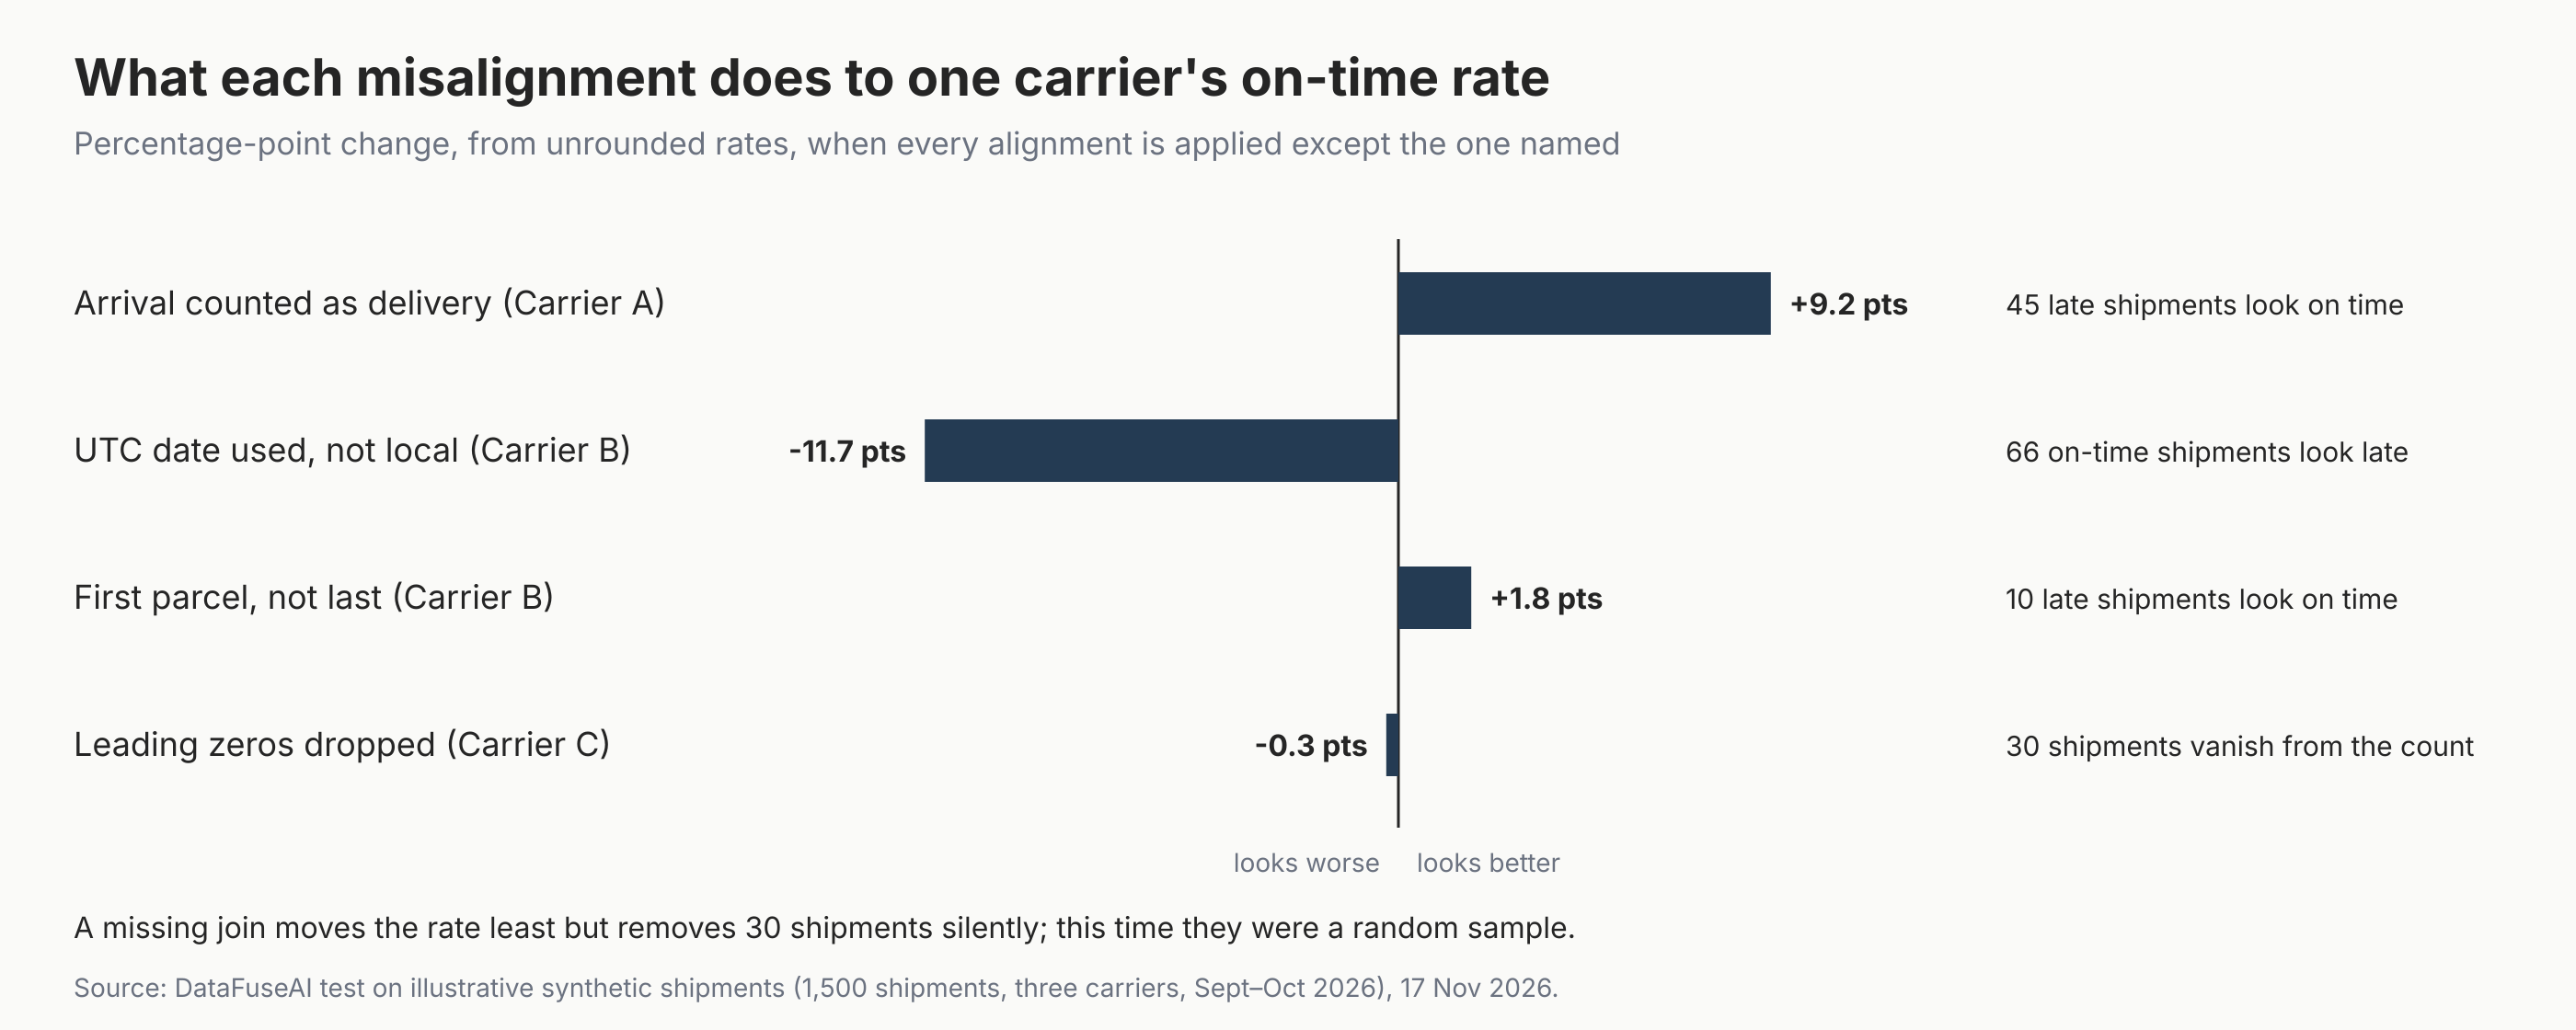
The leading-zero row is the quiet one. Carrier C's rate barely moved, because the 30 shipments that failed to join were a random sample. If late shipments had been the ones to lose their join, the rate would have risen with no visible cause. Report the count of unjoined shipments beside every rate.
What do the errors look like in one shipment?
Two shipments in our data show the event and clock errors. Their raw feeds get them wrong in opposite directions: one late shipment looks on time, and one on-time shipment looks late.
Shipment SH-700357, Carrier A, was promised for 6 October in Illinois. The truck arrived at 20:21 that evening (X1) and finished unloading at 09:21 on 7 October (D1). Scored on arrival, it was on time; scored on completed unloading, it was a day late.
Shipment SH-700763, Carrier B, was promised for 21 September in Illinois. Its API timestamp reads 00:38 UTC on 22 September, which was 19:38 Chicago time on 21 September. Scored on the UTC date it was late; on the local date it was on time.
Four alignments before you compare carriers
Comparing carriers fairly takes four alignments, applied to every carrier on every run. They are a DataFuseAI editorial framework, not an industry standard. Agree the promise date first: the date the customer requested or the date you committed.
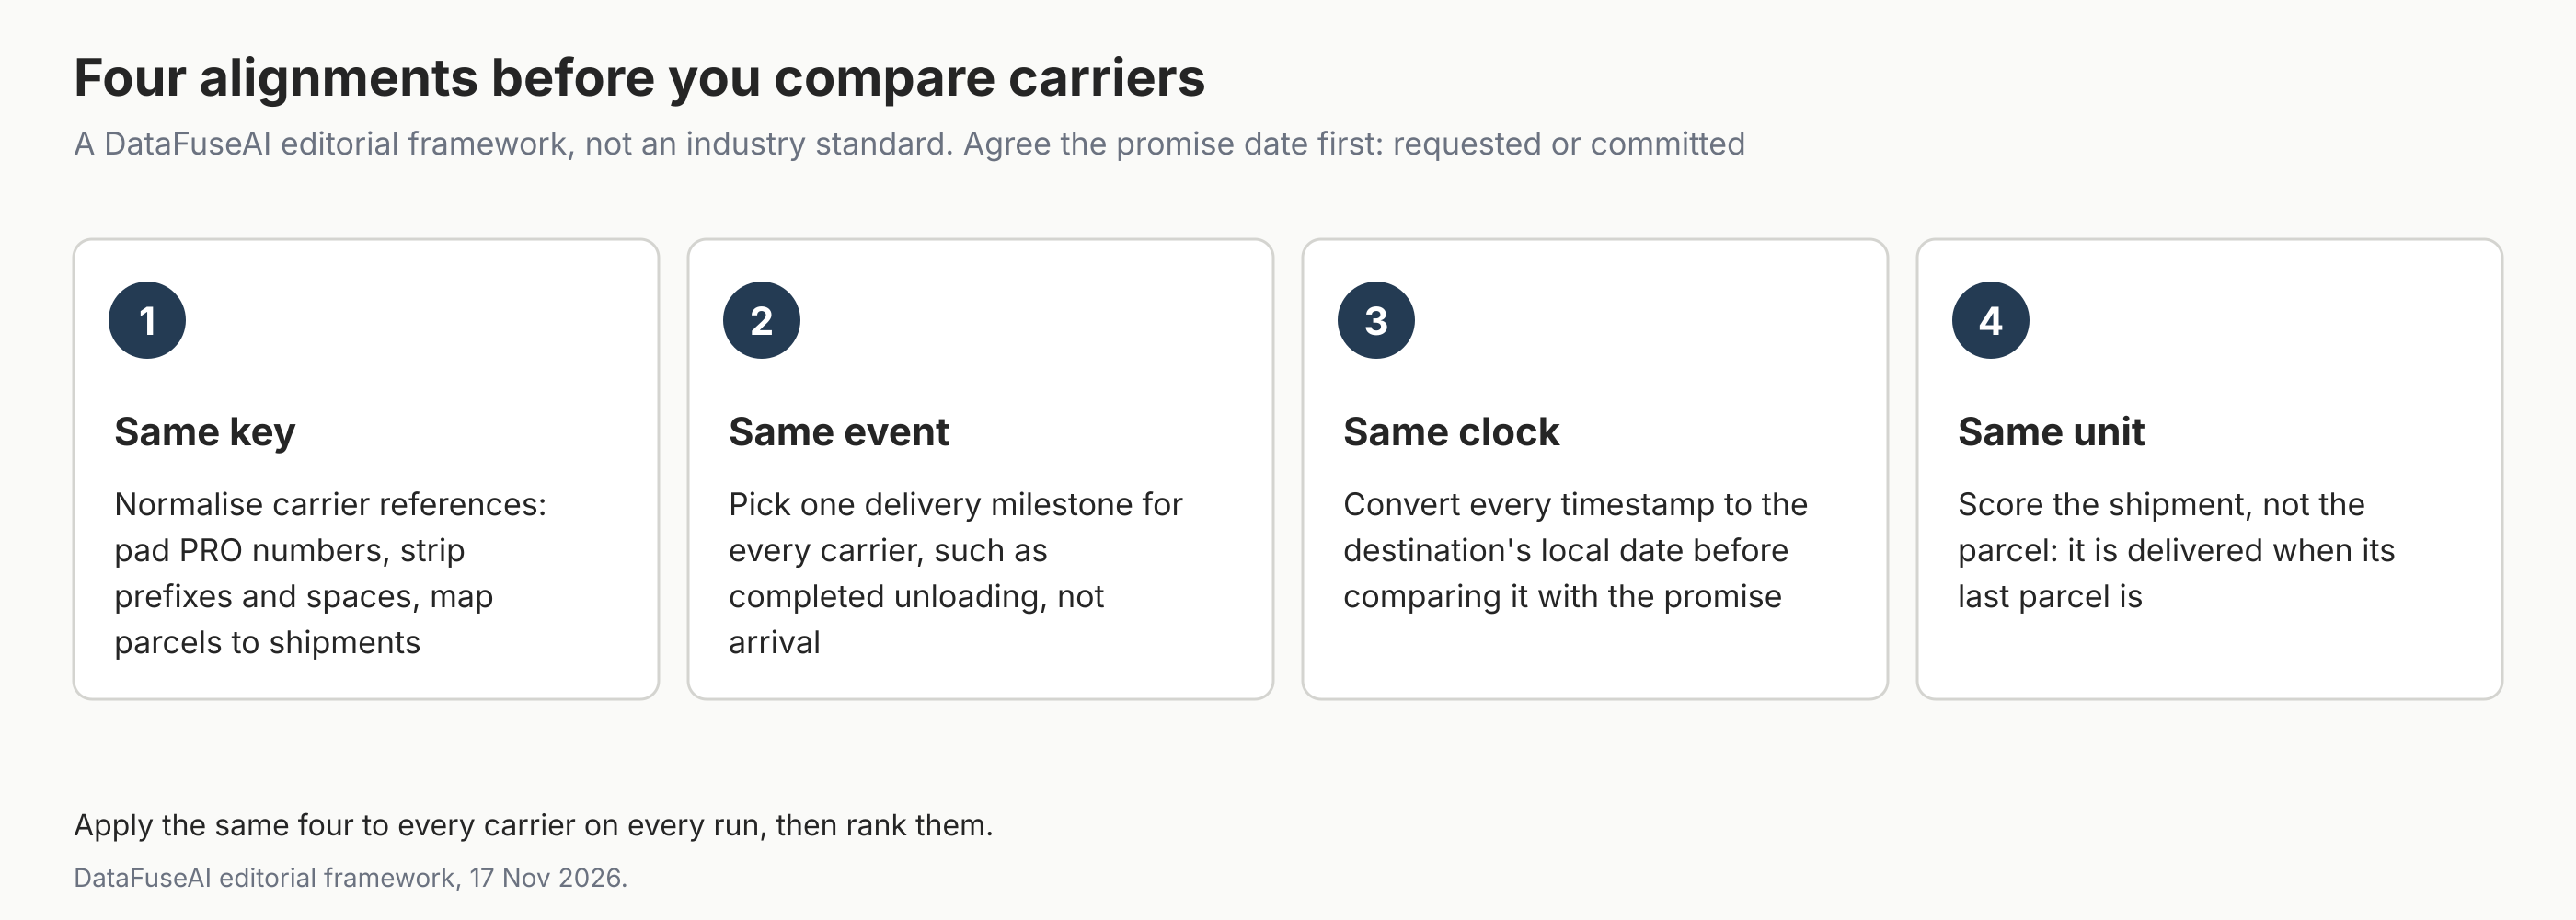
- Same key. Normalise carrier references before joining: pad PRO numbers to their full length, strip prefixes and spaces, and map parcels to shipments. Count what still doesn't join.
- Same event. Pick one delivery milestone and apply it to every carrier. In EDI 214 terms, that could be X1 (arrival) or D1 (completed unloading) [1].
- Same clock. Convert every timestamp to the destination's local date before comparing it with the promise. Keep the original timestamp and its zone beside it.
- Same unit. Score shipments, not parcels. A multi-parcel shipment is delivered when its last parcel is.
Mistakes to avoid
- Ranking carriers on the rate each feed implies. In our test, that put the worst carrier second.
- Treating any "delivered-ish" event as delivery. Arrival and completed unloading are separate EDI statuses.
- Taking the date part of a UTC timestamp. Late-evening deliveries in the Americas can move to the next UTC date.
- Dropping unjoined rows without counting them. The rate can look stable while the sample shrinks.
- Changing the on-time definition mid-quarter. Scores before and after the change no longer compare.
Where DataFuseAI fits (and where it doesn't)
DataFuseAI can bring the TMS and carrier feeds together on a schedule, with the four alignments as steps you configure. Its transportation and logistics page describes connecting TMS, WMS, carrier feeds, customs and trade files, databases and REST APIs as read sources [4].
That page's example is similar to this test: one carrier drops a file overnight, another posts to an API hourly, and a third sends EDI on a weekly batch [4]. It describes scheduled runs that match each carrier's drop cadence, and the source systems stay where they are [4]. The pipeline automation page says each run's duration, status and step log are kept [5].
What it does not do matters here. The page doesn't describe on-time scoring, status-code mapping or time-zone handling as features, so those would be transform steps you configure. Its walkthrough runs on synthetic benchmark trade data, not customer shipments [4]. Check with the team how the four alignments would be built before relying on them.
To try the four alignments on one recurring carrier report, DataFuseAI's free 30-day POC asks for one recurring workflow and two or three data sources [6]. Applications are reviewed for fit, there is no POC fee or obligation, and external cloud or compute costs, if any, stay with you [6].
Frequently Asked Questions
Why does my carrier's on-time rate differ from my own calculation?
Usually because the carrier and you measure different things. The carrier may count arrival rather than completed delivery, use its own estimated date rather than your promise, or score parcels rather than shipments. Ask for the event codes and timestamps behind its figure, then apply your definition to every carrier the same way.
Should on-time delivery use local time or UTC?
Use the destination's local date when comparing with a promised delivery date, because the promise is a local calendar date. Store the original timestamp with its zone so nothing is lost. In our test, reading UTC dates made 66 of Carrier B's on-time shipments look late.
What is the difference between EDI 214 X1 and D1?
In the X12 214 shipment status message, X1 means the carrier arrived at the delivery location and D1 means unloading was completed there [1]. They can fall on different days when a truck arrives after hours. Pick one as your delivery event and use it for every carrier.
How often should carrier data be combined?
Match each carrier's own cadence, because a pipeline can only use what has arrived. A daily run suits daily files and API polls; a weekly feed limits that carrier's scorecard to weekly. Score each period only after every carrier's data for it has landed, or flag the gap.
Methodology
Data. Synthetic and illustrative, generated in Python with seed 20261216. 1,500 shipments shipped 1 September to 20 October 2026, promised two to four days after shipping. Carrier A had 491 shipments, B 565 and C 444. Destinations used the New York, Chicago, Denver and Los Angeles time zones.
Planted differences. Carrier A sent X1 and D1 per shipment in local time; 61 unloaded the next morning after an evening arrival. Carrier B sent UTC timestamps for 1 to 3 parcels per shipment; 215 had more than one. Carrier C's weekly file dropped leading zeros on 30 of 53 references that had them.
Measures. On time means delivered on or before the promised date, by destination local date, at completed unloading, for the last parcel. Planted on-time chances were 90%, 88% and 92%, and are invented. For Carrier A, the 90% applied to the arrival date; a separate 12% rule then moved unloading to the next morning, making 45 more shipments late. Scripts ran on 17 November 2026 between 03:57 and 04:08 UTC.
Limits. Real feeds carry exceptions, attempted deliveries, corrected events, appointment changes and carrier estimated dates, which this test leaves out. Because every difference was planted and modelled exactly, the aligned result matches the truth by construction. Each error type was given to one carrier, and the A and B ranking flip comes from the rule planted for Carrier A. The test measures a method, not any carrier or product.
References
- ArcBest. "214 Transportation Carrier Shipment Status Message" (EDI specification). Accessed 17 November 2026. https://arcb.com/sites/www/files/2024-12/ArcBest-EDI-Specs-214.pdf
- Stedi. "AT7 Shipment Status Details." X12 reference. Accessed 17 November 2026. https://www.stedi.com/edi/x12/segment/AT7
- McKinsey & Company (Alan Davies, Shruti Lal, Fernando Perez, Sanjhali Potdar). "Defining 'on-time, in-full' in the consumer sector." 13 June 2019. Accessed 17 November 2026. https://www.mckinsey.com/industries/consumer-packaged-goods/our-insights/defining-on-time-in-full-in-the-consumer-sector
- DataFuseAI. "Aggregate Shipment and Trade Data Before Your Reporting Window Closes." Accessed 17 November 2026. https://www.datafuseai.com/industries/transportation-logistics
- DataFuseAI. "Data Pipeline Automation, Scheduling & Monitoring." Accessed 17 November 2026. https://www.datafuseai.com/solutions/data-pipeline-automation
- DataFuseAI. "Free 30-Day Data Integration POC." Accessed 17 November 2026. https://www.datafuseai.com/free-poc


 Request a Demo