

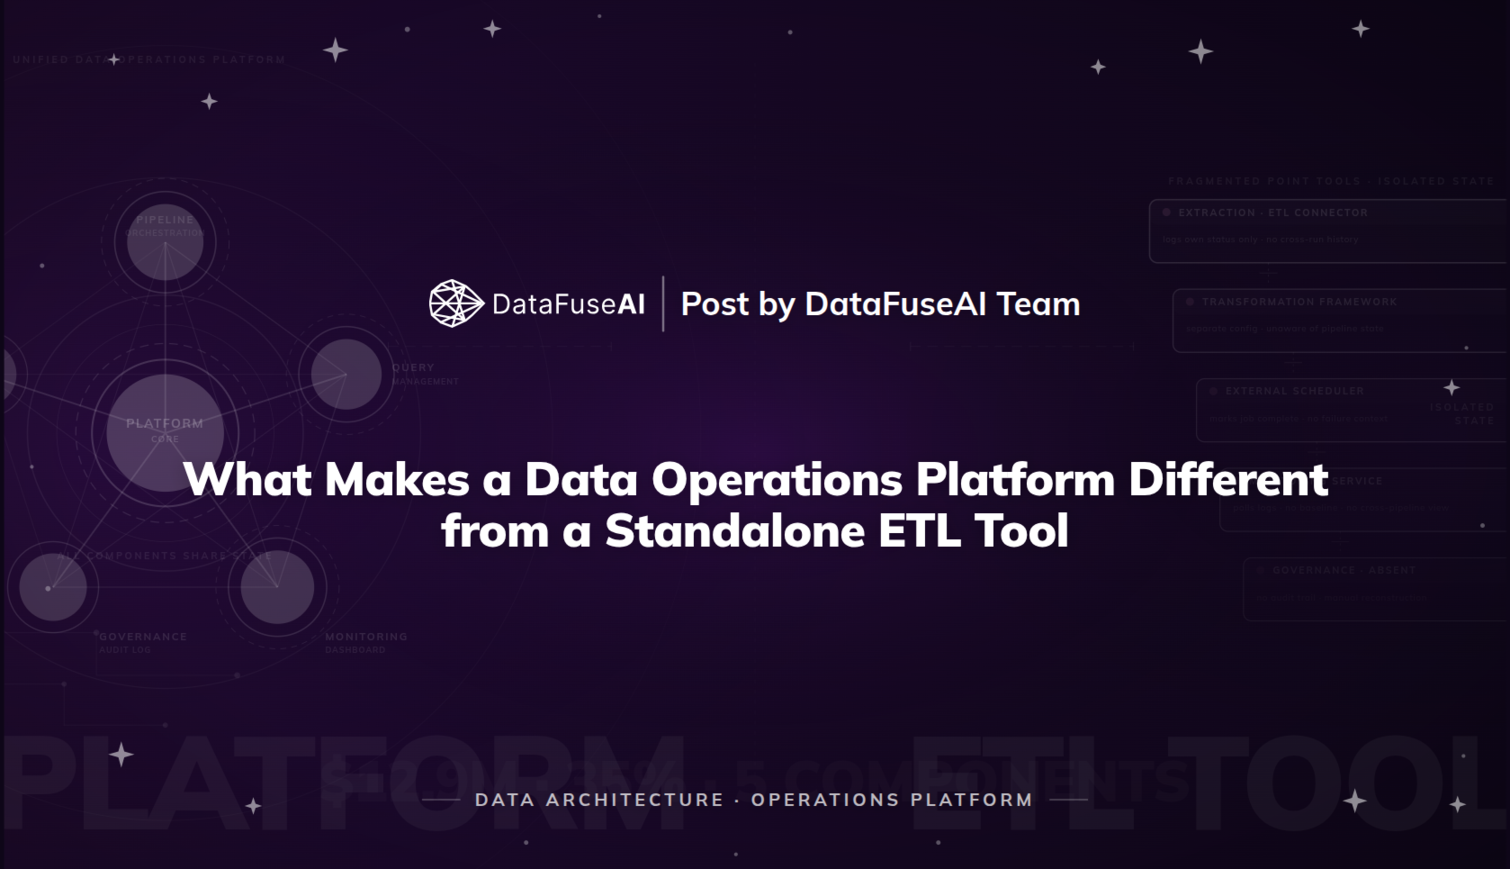
A data operations platform combines pipelines, query management, job scheduling, unified monitoring, and governance in one environment where all components share state. A standalone ETL tool handles extract, transform, and load only — no shared monitoring layer, no scheduling engine, no audit trail. That architectural gap widens as pipeline count and compliance requirements grow.
The phrase "ETL tool" has become a loose proxy for "data infrastructure" in many team conversations — a conflation that costs teams in operational overhead they don't see coming. Moving data from a source to a destination is the beginning of a data pipeline operation. Scheduling the job, monitoring its execution history, managing access controls, and maintaining an audit trail are the operations that surround it. Without them, the pipeline runs without context.
What follows defines the data operations platform as an architectural category — not a marketing one — maps the five components that create the boundary between a platform and a point tool, and marks the inflection point where the choice between them carries real operational consequences.
What Is a Data Operations Platform?
A data operations platform is a unified environment that manages the full operational lifecycle of data movement: how data moves, when it moves, whether it moved correctly, who authorized it to move, and what happened when it didn't. It is not a data warehouse, a transformation framework, or a pipeline monitoring bolt-on. It manages the mechanics of data operations — pipelines, queries, scheduling, visibility, and governance — within a single system where all five components share state.
That last part is the architectural distinction that matters. Shared state means the scheduler knows about pipeline failures. The monitoring dashboard knows about configuration changes. The audit log knows about both. When a pipeline fails at 2 a.m., a platform surfaces the failure, links it to the execution state at the time, and routes the alert through the same system that recorded the run. A collection of point tools can approximate this — but each integration between them is a handoff that can fail, a schema that can drift, and a log that requires manual correlation.
The concept is sometimes conflated with DataOps — the methodology that applies DevOps principles to data pipeline operations. That methodology describes a way of working; the platform is the tooling layer that makes it operationally durable. A team can attempt to follow DataOps principles using fragmented tools, but consistent observability, rapid incident response, and reproducible audit trails are difficult to sustain when the components don't communicate. The platform removes the organizational overhead of maintaining that communication manually.
DataFuseAI's product overview describes how this unified environment is structured in practice.
What a Standalone ETL Tool Actually Does
A standalone ETL tool does one thing well: it moves data from a source to a destination, applying transformation logic in between. Source connection, transformation rules, destination write — those three functions define its scope. Most standalone tools handle this part reliably, and some handle it exceptionally well at scale.
What they don't handle is everything surrounding that movement. There's no scheduling engine built in — teams reach for cron jobs, Apache Airflow, or a separate orchestrator. There's no monitoring dashboard that shows failure patterns across the last ten pipeline runs — the ETL tool logs its own status per-run, and that log usually doesn't persist cross-run history in a form an engineer can query at 7 a.m. when something went wrong overnight. There's no query layer for ad-hoc investigation against source connections. There's no access control system that records who changed a transformation configuration, when, and what the previous state was.
None of that is a design flaw. A standalone ETL tool is built to solve the extraction and loading problem. It solves that problem. The issue arises when teams treat it as a complete operational environment — when the ETL tool ends up serving as the monitoring system, the orchestrator, and the governance layer by accident. At that point, it's doing work it wasn't architected to do, and the gaps become visible when a pipeline fails silently on the last day of the quarter and there's no cross-run history to trace how long the problem has been accumulating.
The ETL tool knows its own state. A data operations platform means every component knows the state of every other component.
That architectural difference — isolated state versus shared state — is what the rest of this piece is about.
The Five Components That Separate a Platform from a Tool
These five components must coexist in one environment, sharing state, for a system to qualify as a data operations platform. A system missing any one of them is a point tool, or a collection of point tools, regardless of how many connectors it has.
1. Pipeline OrchestrationThe ETL engine itself — connection management, transformation logic, load execution. Every tool and every platform has this. It's the baseline, not the differentiator. Where orchestration matters in the platform context is that the pipeline engine feeds its execution state — record counts, run duration, error messages, configuration version — into the shared monitoring layer in real time, not into a siloed log that requires separate querying.
2. Query ManagementA standalone ETL tool moves data. A platform also lets engineers and analysts query the data it manages — ad-hoc investigation against source connections, connection testing, scheduled queries to verify output. This layer closes the loop between what the pipeline produced and what a team member needs to verify immediately after a run. Without it, checking whether last night's output is correct requires leaving the platform entirely and switching to a separate database client, losing the operational context in the process.
3. Job SchedulingScheduling in a platform is dependency-aware and failure-informed. It knows the pipeline failed last night; it can retry, escalate, or hold dependent jobs based on that state. A cron job or external orchestrator doesn't have that context unless someone engineers the integration. Data pipeline automation at the platform level means the scheduler and the execution engine share the same operational record — no separate notification channel, no manual handoff.
4. Unified Monitoring DashboardThis component most clearly separates a platform from a tool collection. Not "did this pipeline succeed?" — every ETL tool surfaces that. The question a unified monitoring layer answers is: "Which of my twenty-eight pipelines has been showing intermittent failures for the last three cycles, and which source connection is the common factor?" That cross-pipeline, cross-time visibility requires all pipelines to report into a single monitoring layer with a consistent execution record. System-level metrics — CPU, memory, disk — logged alongside pipeline status, at consistent intervals, in the same environment where the pipelines run.
5. Governance and Audit LoggingAccess controls scoped to specific operations — who can run a pipeline, who can edit a transformation, who can delete a log entry — with an execution audit trail that captures user, action, and configuration state at runtime. This is the component that converts a data operation into an accountable one. Data governance and compliance requirements make this non-optional for regulated industries; the platform model makes it automatic rather than retroactively assembled.
Why "shared state" matters for all five components: Each component in isolation produces a log, a status, or an alert. When they share state, those outputs become a coherent operational record. The scheduler's retry logic is informed by the monitoring layer's failure history. The audit log captures not just that a run happened, but the exact configuration active at the time. That coherence is what makes a platform auditable, debuggable, and operationally manageable at scale.
Where Point Tools Break Down: The Integration Debt Problem
Consider the operational stack many data teams assemble over eighteen months: a connector tool for extraction, a transformation framework, a separate orchestrator for scheduling, a monitoring service that polls logs from the previous three, and a ticketing system for when something goes wrong. Each tool works. None of them share state.
Here's a concrete pattern that recurs in this setup. A batch pipeline runs at 2 a.m. The ETL tool logs a success status — it extracted, transformed, and loaded without a reported error. The orchestrator marks the job complete. The monitoring service, which polls the ETL tool's log, shows green. But 4,000 output records were silently dropped because a schema change in the source system altered a column type and the transformation logic processed a truncated input without surfacing an error. Each component completed what it was asked to do. The operation as a whole produced wrong output, and nothing alerted.
This pattern — silent partial success because no component holds a cross-system expectation — is precisely what drove the documented failure at Public Health England in October 2020. A reporting pipeline completed with a success status while silently dropping records past an Excel row limit. No output validation existed. No cross-run count baseline was defined. Over eight days, 15,841 confirmed COVID-19 cases went unreported and an estimated 50,000 contacts went untraced, not because the individual tools failed, but because there was no unified layer to detect that the operation had.[3]
The IBM Institute for Business Value has measured the average annual organizational cost of poor data quality at $12.9 to $15 million.[1] Much of that figure traces to exactly this mechanism: data that moved, but incorrectly, through systems where no component held a cross-pipeline view of what the output should have contained. Building an audit-ready data operation requires that monitoring and execution share state — which point tools, by architectural definition, don't.
- ETL tool logs success — no output record count stored
- Orchestrator marks job complete — no awareness of pipeline errors
- Monitoring service polls logs — sees green, holds no baseline for expected output
- Governance: absent — no access audit, no config state captured at execution
- When an incident occurs: reconstruct from memory, git history, and Slack messages
- When an audit arrives: manual document assembly under deadline pressure
- Execution logged: user + action + config state + input/output record count
- Scheduler has cross-job failure context; dependent jobs respond accordingly
- Monitoring surfaces failure patterns across last execution cycles in one view
- Governance audit trail captured automatically at runtime — no extra instrumentation
- When an incident occurs: query the execution log directly
- When an audit arrives: system produces the trail; no reconstruction required
A 2024 survey of financial planning and analysis professionals found that only 35% of practitioner time goes to generating insights — the rest is consumed by data collection, validation, and reconciliation.[2] Some of that overhead is inherent to the work. Part of it is the operational cost of systems that don't share state: checking whether last night's pipeline ran correctly requires consulting three dashboards maintained by three tools that have no awareness of each other.
Integration debt accrues the same way technical debt does — invisibly until the compounding becomes impossible to ignore. Five point tools that each work correctly but don't share state is a manageable situation with three pipelines. At thirty pipelines, the maintenance overhead of the glue between them becomes a meaningful fraction of engineering capacity.
When an ETL Tool Is Enough (and When It Isn't)
Standalone ETL tools serve real use cases well. The question isn't whether to use one — it's whether the current operational situation fits the architectural limitations of the point tool model.
The signals that a standalone ETL tool fits: fewer than five pipelines, a single destination, no compliance exposure, and one engineer who holds the full context of every pipeline in working memory. At that scale, the integration debt from point tools is manageable because the overhead is small and the complexity of a full platform would outweigh the benefit.
| Dimension | Standalone ETL Tool Fits | Data Operations Platform Fits |
|---|---|---|
| Pipeline volume | 1–5 pipelines, stable count | 5 or more, growing over time |
| Destination types | Single destination or warehouse | Multiple, heterogeneous destinations |
| Compliance requirement | None applicable | GDPR, HIPAA, SOX, or equivalent |
| Monitoring depth | Per-pipeline success/fail is sufficient | Cross-pipeline patterns and historical cycles needed |
| Team visibility | One engineer holds full context | Multiple engineers or teams share pipeline ownership |
| Scheduling complexity | Simple time-based triggers | Dependencies, retries, conditional logic required |
| Governance requirement | Not required | Access audit or execution audit trail required |
| Deployment flexibility | Cloud-only is acceptable | Private-hosted or on-premise required |
A single pipeline feeding one data warehouse, no regulatory exposure, one engineer who can answer any question about the system without looking anything up — a standalone ETL tool is the right call. The calculation changes when pipelines multiply, compliance requirements emerge, or the operational context leaves the team when that engineer does.
The compliance threshold is binary, not sliding. A team with one pipeline that touches personal health data faces the same HIPAA audit control requirements as a team with fifty. Pipeline count doesn't determine compliance exposure. The presence of regulated data does. At that point, the governance component of a platform is not a scaling luxury — it's a statutory requirement.
How DataFuseAI Implements the Platform Model
DataFuseAI is built around all five components as a single unified environment, with three deployment models all generally available: managed cloud SaaS, private-hosted on customer infrastructure, and on-premise offline with no external internet connectivity. That last option — fully offline deployment within a private network — has no equivalent among major standalone ETL tools. For government contractors, healthcare organizations with zero-egress mandates, and defense-adjacent teams, it's not a preference; it's a hard requirement.
Pipeline orchestration connects to 50+ data sources: 25 dedicated RDBMS variants, 8 AWS RDS connector types, 6 Azure cloud database connectors, plus NoSQL coverage across MongoDB, Cassandra, Couchbase, and Azure Cosmos variants. The visual drag-and-drop pipeline builder mirrors the underlying system architecture — the UI structure maps to what the pipeline actually does, which reduces the gap between what an operator builds and what the system executes. Compute engine flexibility spans Databricks, Apache Livy, and DataFuseAI's native engine with no lock-in to a single processing layer.
Unified monitoring surfaces job failure history across the last five execution cycles — not just the most recent run. System metrics (CPU, memory, disk) are collected at ten-second intervals. Email alerts fire on scheduled job failure. Pipeline-level aggregation and connection status are visible together in one dashboard, not distributed across separate tools that an engineer must consult in sequence.
Governance is action-level: permissions are scoped to specific operations within specific modules — running a query, starting a cluster, editing a transformation, deleting a log entry. Not broad role categories assigned at the group level, but granular control at the operation level. The execution audit trail captures user, action, and configuration state at runtime. When an auditor asks what configuration was active at the time of a specific pipeline run, the answer is in the system — not reconstructed from git history and memory.
On ELT: DataFuseAI's ELT capability — warehouse-native transformation — is currently in beta, not generally available. Teams whose primary destination is a cloud warehouse and whose workflows require pushdown ELT in production today should factor that timeline into their evaluation. The platform's ETL capability is fully production-ready across all connector categories listed above.
The benchmark DataFuseAI has published covers 60 million rows per pipeline run (75 million combined) on a two-core, 16 GB Databricks single-node machine, with peak throughput of 64,439 rows per second. Those numbers reflect the platform operating under generalized, untuned conditions — no indexed tables, no parallelism tuning, no PostgreSQL configuration optimization. In a production deployment with infrastructure matched to the workload, the ceiling is higher.
The architectural question — platform or point tools — is a decision about what the operational overhead looks like as pipeline count grows. Both approaches work at low pipeline counts. The platform model is built for the complexity that follows.
Frequently Asked Questions
DataOps is a methodology — a set of practices for building and operating data pipelines faster and more reliably, drawing from DevOps principles: automation, testing, observability, continuous delivery. A data operations platform is the tooling layer that implements those practices.
A team can attempt to follow DataOps principles using fragmented point tools, but the methodology breaks down at scale when those tools don't share state, can't surface cross-pipeline failure patterns, and can't produce a lineage-complete audit trail. The platform removes the manual coordination overhead that would otherwise be needed to connect those tools. DataOps as a practice; the platform as the infrastructure that makes the practice durable.
Apache Airflow is a workflow orchestration tool — it handles job scheduling, dependency management, and DAG-based pipeline execution. It is one of the five components described in this piece (job scheduling), not all five.
Airflow doesn't include a built-in pipeline builder for source-to-destination ETL, doesn't manage source connection credentials natively for data movement, doesn't include a unified monitoring dashboard for data quality metrics, and doesn't include governance or execution audit logging in the sense described here. It can serve as the scheduling layer of a data operations stack, but the other components must come from elsewhere — which is the integration debt problem in practice.
Pipeline count is one signal, but not the only one. The inflection point is typically around five to ten pipelines, when cross-pipeline visibility starts to matter and operational context can no longer fit comfortably in one person's working memory. At fewer than five pipelines with a single destination and no compliance requirements, a standalone ETL tool is often sufficient.
Compliance exposure changes the calculation entirely. A single pipeline touching regulated personal data faces the same statutory audit control requirements as fifty pipelines. The governance component of a platform becomes non-optional at that point regardless of pipeline count. Team size matters too: when more than one engineer shares ownership of pipelines, the absence of a unified operational record creates coordination overhead that grows with every new person added.
No. These are complementary layers in the same data infrastructure, not substitutes. A data operations platform handles how data moves, when it moves, whether it moved correctly, and who authorized it to move. A data warehouse handles where the transformed data lives, storage optimization, and the performance of analytical query workloads.
Some cloud warehouses include limited built-in ingestion tools — a narrowly scoped connector for common SaaS sources. Those cover one of the five platform components (pipeline orchestration, partially), not the operational scope described here. A team typically needs both: the platform orchestrates and governs the data pipeline; the warehouse stores and serves the output.

 Request a Demo