
A revenue dashboard rarely breaks loudly. In our test, loading one day of orders twice raised 7-day revenue by 12.6% without a single error message. To validate data before it reaches a dashboard, load each new batch into a staging table, run checks on shape, meaning and completeness, and publish only when the blocking checks pass. DataFuseAI's data quality page notes that quality faults surface as a plausible-looking wrong figure rather than as an error message [1].
We tested that approach. We broke one day of illustrative orders data in eight different ways and ran nine SQL checks against each version. Every defect was caught by at least one check. Plain-SQL versions of the four tests dbt ships built in caught five of the eight. Figures checked 16 November 2026, when the checks were run on PostgreSQL 16.
Who this is for: analysts and data engineers who own a dashboard fed by a nightly pipeline and want a gate in front of it. For where each type of check belongs in an ETL pipeline, see our guide to data quality validation in ETL pipelines.
Key Takeaways
- Nine checks caught all eight defects, with no false alarm on the clean batch. Three defects were caught by only one check each.
- The built-in four aren't enough on their own. Our SQL versions of dbt's not null, unique, relationships and accepted values tests caught five of eight defects. They missed a partial load, a missing batch and amounts sent in cents.
- The smallest errors are the hardest to catch. Three defects moved 7-day revenue by less than 1.5% each. Each was caught by exactly one check.
- Source totals can't see an error the source repeats in its own totals. Reconciling to the source's control totals caught the pipeline faults and the renamed column, but missed the cents and the missing amounts, because the source's totals included them.
- Decide what blocks and what warns before the first failure. A gate that only logs doesn't protect the dashboard.
What does it mean to validate data before a dashboard?
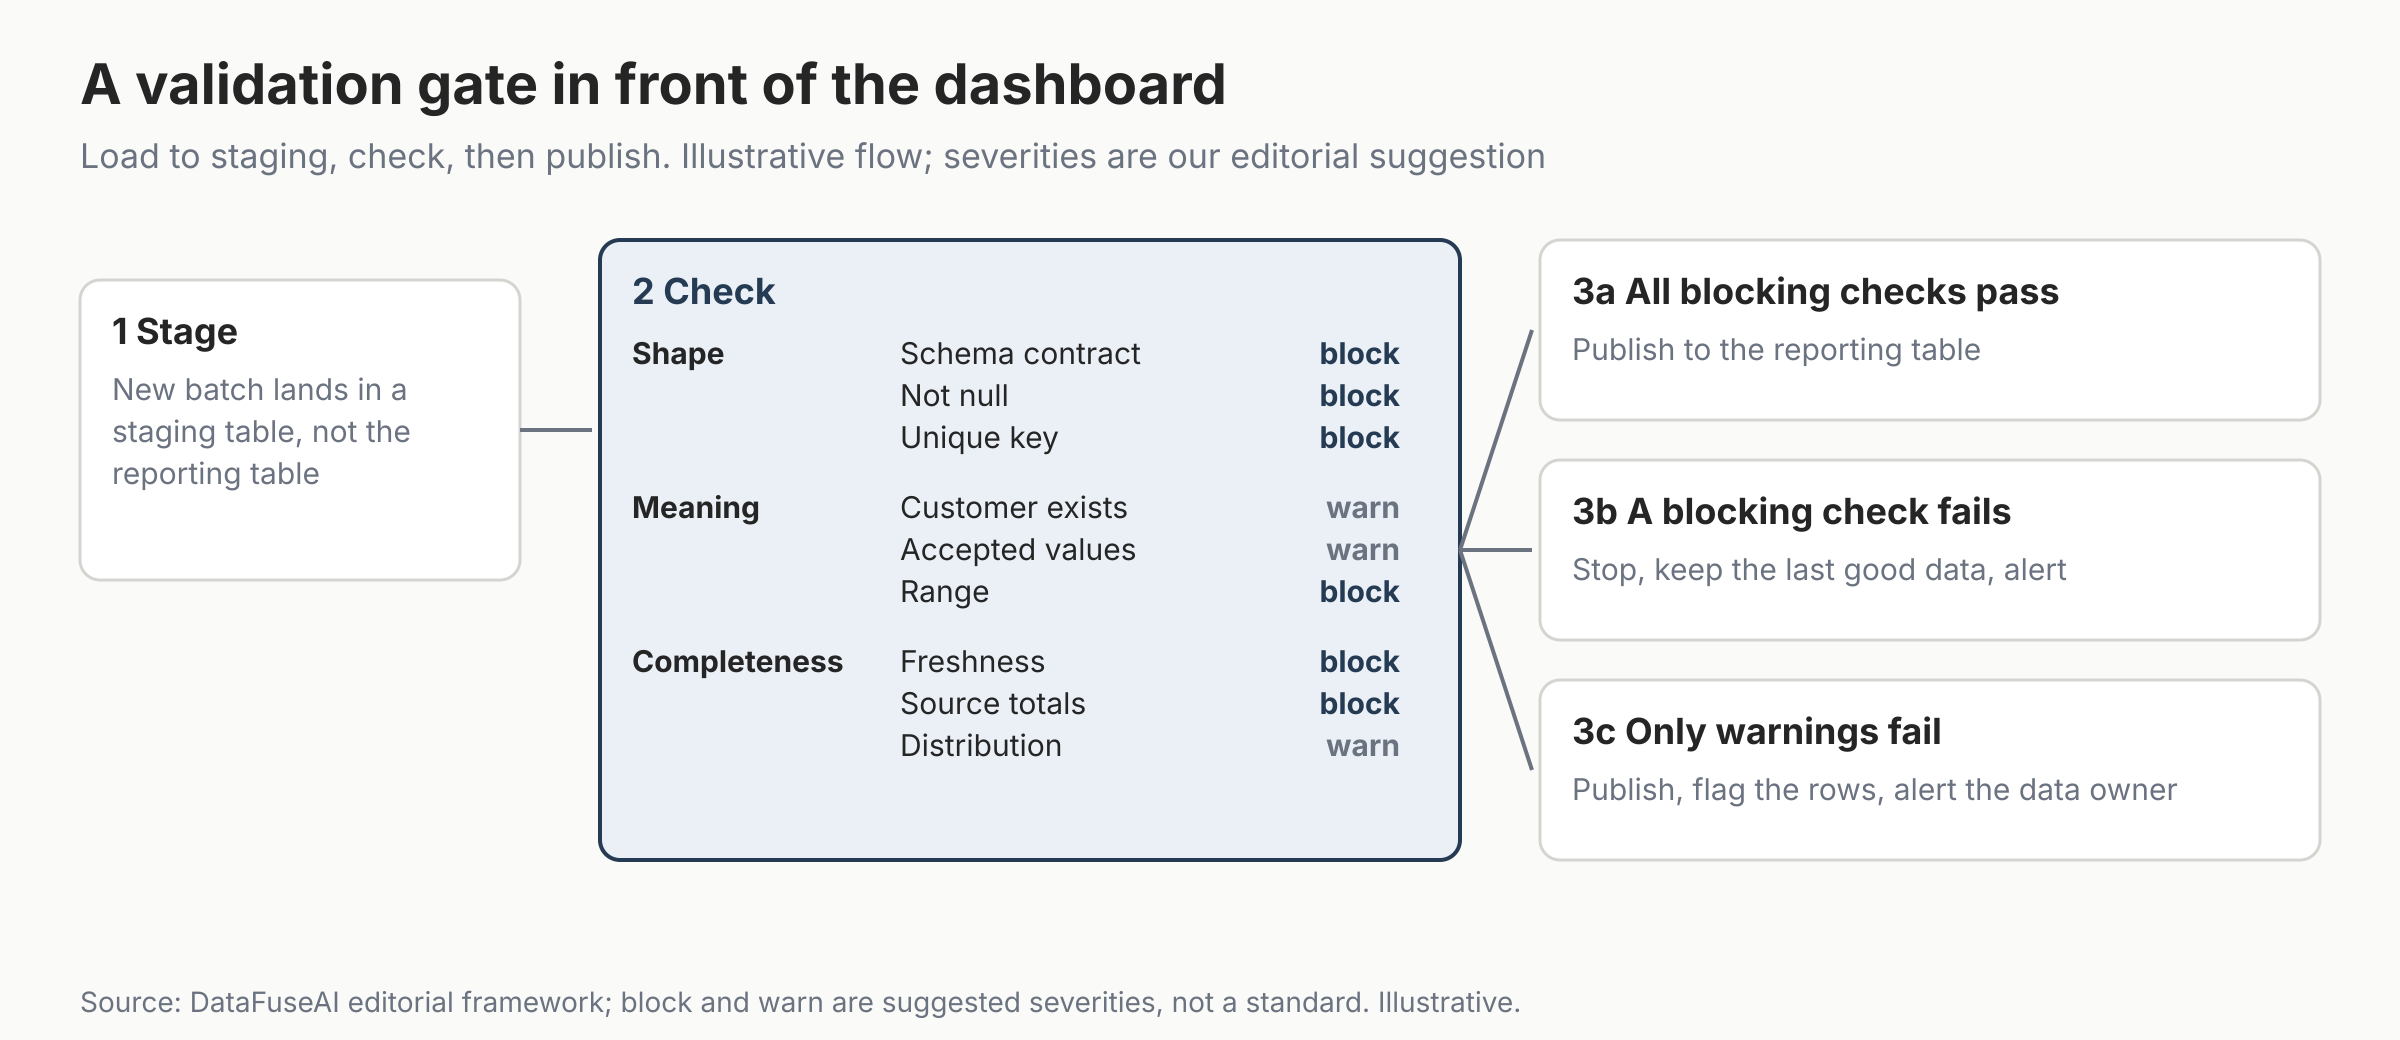
Validating data before a dashboard means checking each new batch against rules you agreed in advance, before the rows reach the tables the dashboard reads. The batch lands in a staging table. Checks run against the staging rows plus what is already published. Only if the blocking checks pass do the rows move into the reporting table.
The checks fall into three groups, which we use as the structure of this guide:
| Group | Question it answers | Checks in our test |
|---|---|---|
| Shape | Do the rows have the agreed structure? | Schema contract, not null, unique key |
| Meaning | Do the values make sense for the business? | Customer exists, accepted values, range |
| Completeness | Did everything arrive, on time and in full? | Freshness, source totals, distribution |
The three-group gate. Source: DataFuseAI editorial framework, not an industry standard.
How we tested nine checks against eight defects
We built an illustrative orders table and broke one day of it eight ways. The table holds 5,882 orders over 29 days, from 17 October to 14 November 2026, with 163 to 237 orders a day. The new batch is 200 orders for 15 November. Orders belong to the 15 customers from our running Robert Smith example, and amounts run from $10 to $500.
Each defect replaces the clean batch:
| Defect | What we changed | Where it starts |
|---|---|---|
| Batch loaded twice | The same 200 rows loaded again after a rerun | Pipeline |
| Partial load | The extract stops after 120 of 200 rows | Pipeline |
| Batch never arrives | No rows for 15 November | Pipeline |
| Missing amounts | 25 orders arrive with no amount | Source |
| Renamed column | The source renames amount to total |
Source |
| Unit change | The source sends amounts in cents | Source |
| Unknown customers | 30 orders reference customers not yet in the customer table | Source |
| New status value | 20 completed orders arrive as refunded |
Source |
Eight injected defects. Source: DataFuseAI test data, 16 November 2026.
The dashboard metric is 7-day revenue from 9 to 15 November: orders joined to customers, excluding returns. On clean data it is $343,919.78. For each defect we also published the batch with no gate and measured how far the dashboard moved.
Which check caught which defect?
Every defect failed at least one of the nine checks, and the clean batch failed none. The defects split into two kinds. Big errors, such as a double load, tripped several checks at once. Small errors, such as 30 orders from unknown customers, tripped exactly one. Those small ones are the reason a gate needs specific rules as well as broad ones.
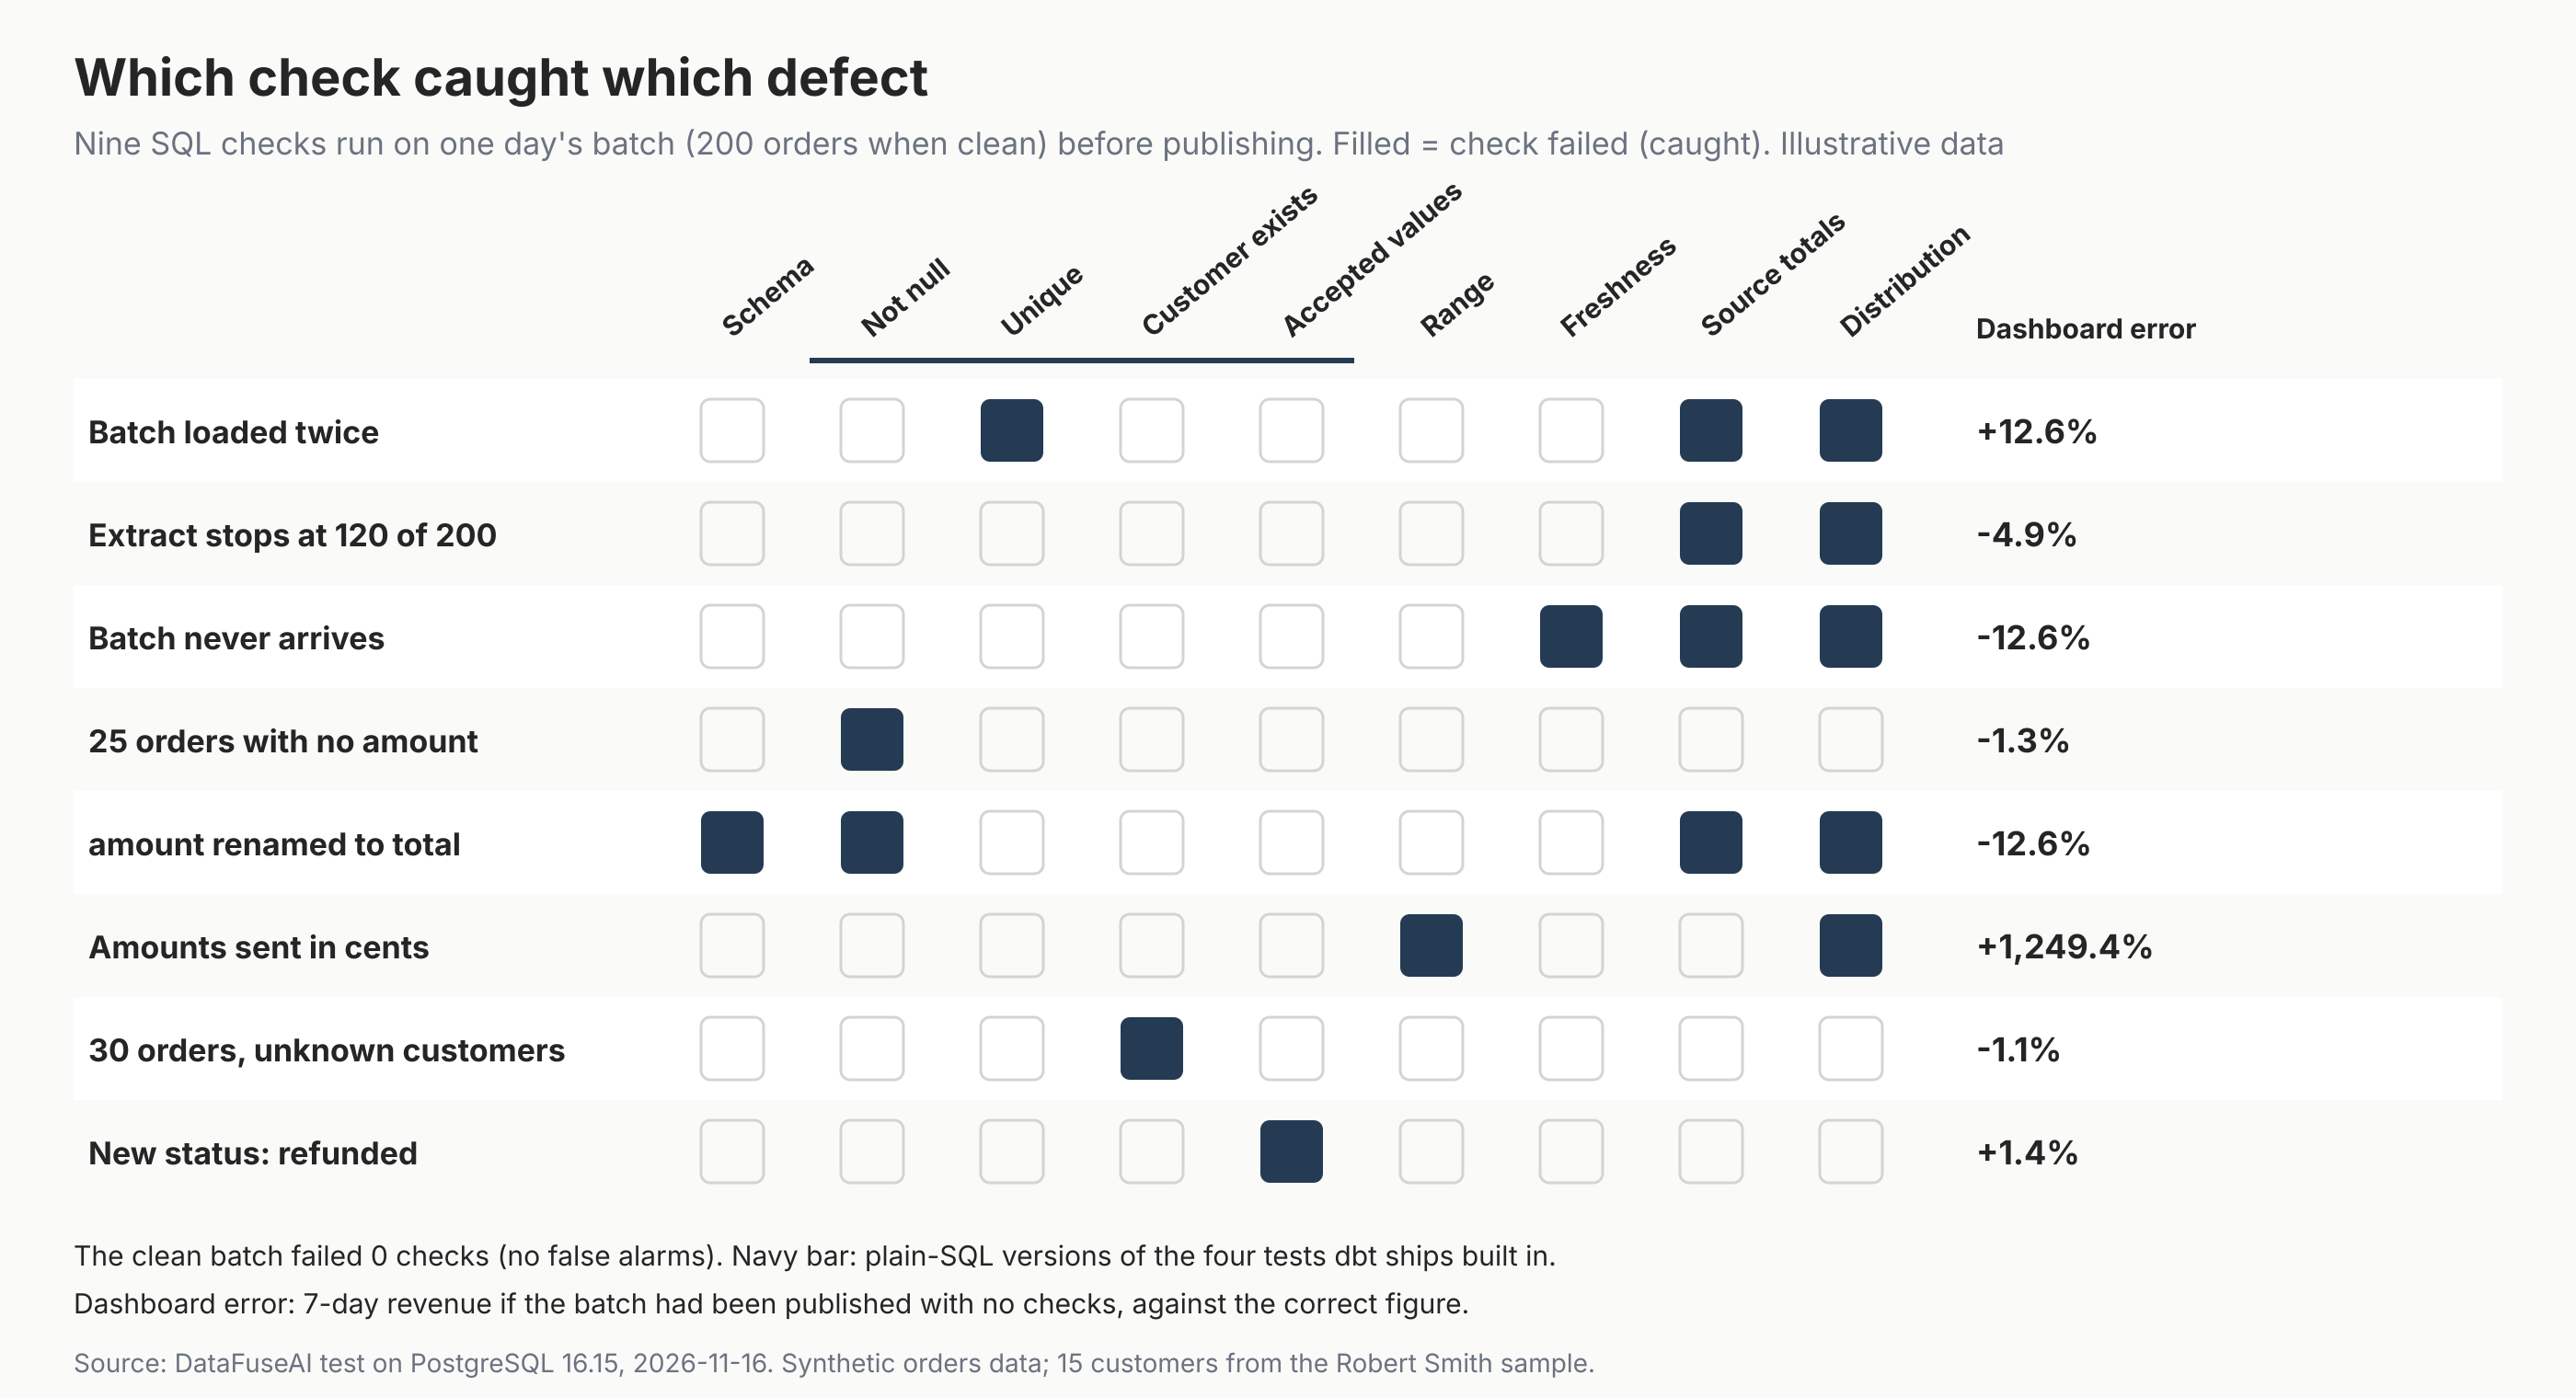
| Defect | Checks that failed | 7-day revenue error with no gate |
|---|---|---|
| Batch loaded twice | Unique, source totals, distribution | +12.6% |
| Partial load | Source totals, distribution | −4.9% |
| Batch never arrives | Freshness, source totals, distribution | −12.6% |
| Missing amounts | Not null | −1.3% |
| Renamed column | Schema, not null, source totals, distribution | −12.6% |
| Unit change (cents) | Range, distribution | +1,249.4% |
| Unknown customers | Customer exists | −1.1% |
| New status value | Accepted values | +1.4% |
Detection results. Source: DataFuseAI test (check_results.json), 16 November 2026.
Three results stand out:
- The built-in four caught five of eight. dbt ships four generic data tests out of the box: not_null, unique, accepted_values and relationships [2]. We didn't run dbt; our plain-SQL versions of those four caught the double load, missing amounts, renamed column, unknown customers and new status. They missed the partial load, the missing batch and the cents.
- The distribution check missed the small changes. It flags a day whose revenue is more than three standard deviations from the last 28 days. The double load scored 7.5 standard deviations and the cents 787, but the missing amounts scored only 1.4, so the check passed them.
- Each of the three smallest errors was caught by one check. Missing amounts (−1.3%), unknown customers (−1.1%) and the new status (+1.4%) look like an ordinary day. Only a rule written for that exact problem flagged them.
Shape checks: schema, nulls and duplicates
Shape checks confirm that rows have the agreed structure before anyone reads their values: the right columns and types, no blanks in required fields, and one row per order. In our test they caught the renamed column, the missing amounts and the double load. They are cheap to run and rarely raise false alarms, which makes them good blocking checks.
The schema check compares the staging table's columns with a contract table. PostgreSQL's information_schema.columns view describes every column the current user can access, including its data type [3]:
SELECT count(*) AS mismatches FROM (
  (SELECT column_name, data_type FROM information_schema.columns
    WHERE table_schema = 'public' AND table_name = 'staging'
   EXCEPT SELECT column_name, data_type FROM contract)
  UNION ALL
  (SELECT column_name, data_type FROM contract
   EXCEPT SELECT column_name, data_type FROM information_schema.columns
    WHERE table_schema = 'public' AND table_name = 'staging')
) d;
When amount became total, this returned 2: one column missing and one unexpected. The not-null check also failed for all 200 rows, because a loader that maps columns by name leaves amount empty.
Run the unique check on what would be published, not on the batch alone. The double-loaded batch had no duplicates within itself. It only duplicated the 200 rows already in the orders table.
Meaning checks: valid customers, statuses and amounts
Meaning checks test whether values make sense for the business: every order's customer exists, every status is one you know how to count, and every amount falls within agreed bounds. In our test they caught the unknown customers, the new refunded status and the switch to cents. Each of those passed every shape check.
- Customer exists. Thirty orders referenced customers the customer table didn't have yet. A dashboard that joins orders to customers silently drops those orders, which cost 1.1% of revenue in our test. dbt calls this check relationships: every record in a child table needs a matching record in its parent [2].
- Accepted values. The
refundedstatus wasn't in the list, so the check failed. A dashboard that excludes onlyreturnedcounted refunds as revenue, overstating it by 1.4%. dbt's accepted_values test fails when any non-null value isn't in the supplied list [2]. - Range. Our bound was $0.01 to $5,000 per order. In cents, 182 of the 200 orders exceeded it. The bound is a business rule, so agree it with whoever owns the numbers.
Completeness checks: freshness, source totals and distribution
Completeness checks ask whether everything arrived, on time and in full. In our test they were the only checks that caught the partial load and the missing batch. The distribution check caught every defect that source totals caught, plus the cents. Source totals still earn their place, because they compare exact counts.
Freshness compares the latest order date with the date you expect. dbt's freshness config sets how old the most recent data can be before a check warns (warn_after) or errors (error_after) [4].
Source totals compare the batch with control totals the source system reports, here a row count and an amount total:
SELECT count(*) = :src_rows
   AND round(coalesce(sum(amount), 0), 2) = round(:src_amount, 2) AS passed
FROM candidate
WHERE order_date = :'batch_date'::date;
It caught every pipeline fault: the double load, the partial load and the missing batch. It missed the cents and the missing amounts. The source's own totals already reported 4,866,002 for the cents batch, and $43,011.31 for the 175 orders that had amounts. A reconciliation proves the pipeline copied the source faithfully, not that the source was right.
Distribution compares today's revenue with the last 28 days. It caught every large change and missed every small one. In our sample, a day's revenue had to move by about 35% before it crossed three standard deviations. The partial load only just crossed, at 3.5. By the same arithmetic, a 10-row shortfall would pass the distribution check but fail source totals.
Which checks should block the dashboard?
Block on checks whose failure means the numbers are wrong. Warn on checks that only show the numbers might be. In our framework, the six blocking checks are schema, not null, unique, range, freshness and source totals. Customer exists, accepted values and distribution warn, because a new customer, a new status or an unusual day can be genuine.
That split is editorial judgement; adjust it to your data. Under it, two of our eight defects, the unknown customers and the new status, would still reach the dashboard, flagged with a warning. Two rules apply whatever you choose:
- A blocking failure must stop the publish. In dbt, a failing test in
dbt buildmakes downstream resources skip, and dbt's docs say to change a test's severity towarnif it shouldn't cause skipping [5]. - A warning still needs an owner. dbt's default severity is
error, anderror_ifandwarn_ifset how many failing rows trigger each [6]. A warning nobody reads is the "log and continue" response our validation guide argues against [7].
When a blocking check fails, keep yesterday's data on the dashboard and alert the owner. A day-old number labelled as such does less harm than a wrong one. Our post on silent data quality failures makes a similar case for output validation with a circuit breaker [8].
Mistakes to avoid
- Testing only the new batch. The double load passed a within-batch uniqueness check. Test what would be published.
- Relying on reconciliation alone. Source totals can't see an error the source repeats in its own totals, such as cents.
- Treating "within normal range" as correct. Our three smallest defects all passed the distribution check; a successful run isn't proof of correct output either.
- Joining away the evidence. An inner join to customers drops orders with unknown customers without any error.
- Warning without an owner. A warning that nobody reads behaves exactly like no check at all.
- Setting bounds from one bad day. Agree ranges and accepted values with the people who own the numbers.
Where DataFuseAI fits (and where it doesn't)
DataFuseAI can run checks like these on its data quality and transformation canvas. A profiling node returns a per-column report with null counts, value ranges and the most frequent value [1]. A validation can be a filter condition on the canvas or SQL in the Query Editor [1].
Scheduled Jobs keep each run's status and log, and notifications can be switched on per Job [9]. The Query Editor runs against the same tables the pipeline writes, so the SQL checks in this guide can run there [1].
It is a weaker fit in these cases:
- Stopping the publish automatically. The data quality page doesn't describe halting a pipeline when a validation fails, or quarantining failing rows [1].
- Declarative test suites. There is no equivalent of dbt's YAML tests with
warn_ifanderror_ifthresholds described on the pages we read [1]. - Distribution baselines. The profiling report plots a statistic across pipeline runs [1], but the pages we read don't describe alerting when a value drifts from that history.
DataFuseAI offers a 30-day proof of concept for one recurring workflow and two or three sources, with no POC fee [10]. Applications are reviewed first, and any external cloud or compute cost is yours.
Frequently Asked Questions
How many data validation checks does a dashboard need?
Start with one check per known way the data can break, then add one from each group: shape, meaning and completeness. In our test, nine checks caught eight defects, but no single group caught them all. Built-in tests such as not null and unique are a starting point. Add freshness and source totals for pipeline faults, and range or accepted values for changes the source makes.
Should a failed check stop the dashboard from updating?
For blocking checks, yes. A failed schema, uniqueness, freshness or source-totals check means the numbers are wrong, so keep the last good data and alert the owner. For checks such as a new status value or an unusual daily total, publish with a warning, because the change may be genuine. Decide which is which before the first failure.
What is the difference between data validation and data profiling?
Profiling describes data: counts of nulls and distinct values, ranges and frequent values. Validation tests it against a rule and returns pass or fail. DataFuseAI's data quality page draws the same line [1]. Profiling helps you choose validation rules, such as a sensible range for amounts, but it doesn't block anything by itself.
Can you validate data in the BI tool instead?
You can add checks there, but by then the bad rows are already in the reporting tables and possibly in other reports. In our test, the dashboard's own join silently dropped the orders with unknown customers, so a check on the dashboard's result could not see them. Validate in staging, before publishing, and use dashboard checks as a backstop.
Methodology
Data. An illustrative orders table generated with a fixed random seed: 5,882 orders from 17 October to 14 November 2026 (163 to 237 a day), and a new batch of 200 orders for 15 November. Amounts are uniform between $10 and $500. Statuses are placed, shipped, completed or returned. Customer IDs are the 15 golden customers from our Robert Smith matching sample.
Defects. Each of eight scenarios replaces the clean batch with a broken version, listed in the defects table. The source's control totals for each scenario are what the source itself would report. In the missing-amounts and cents cases, those totals reflect the source's own error.
Checks. Nine plain SQL checks, run in PostgreSQL 16.15 on the staging rows plus the rows already published. We did not run dbt; four checks mirror its built-in tests. The range bound ($0.01 to $5,000) and the distribution rule (within three standard deviations of the previous 28 days' daily revenue) are our choices. The final run took place at 13:14 UTC on 16 November 2026.
Dashboard error. 7-day revenue (9 to 15 November) for orders joined to customers, excluding returns, after publishing each batch with no gate. It is compared with the correct figure from clean data. For the new-status case, the correct figure excludes the 20 refunded orders.
Limits. This is an illustrative test on synthetic data with no weekly pattern, not a measurement of how often each defect happens. With more day-to-day variation, a distribution check needs an even bigger change before it fires.
References
- DataFuseAI. "Data Transformation & Data Quality Profiling." Accessed 16 November 2026. https://www.datafuseai.com/solutions/data-quality-transformation
- dbt Labs. "About data tests property." dbt Developer Hub. Accessed 16 November 2026. https://docs.getdbt.com/reference/resource-properties/data-tests
- PostgreSQL Global Development Group. "columns" (information schema). PostgreSQL documentation. Accessed 16 November 2026. https://postgresql.org/docs/current/infoschema-columns.html
- dbt Labs. "freshness." dbt Developer Hub. Accessed 16 November 2026. https://docs.getdbt.com/reference/resource-properties/freshness
- dbt Labs. "About dbt build command." dbt Developer Hub. Accessed 16 November 2026. https://docs.getdbt.com/reference/commands/build
- dbt Labs. "severity, error_if, and warn_if." dbt Developer Hub. Accessed 16 November 2026. https://docs.getdbt.com/reference/resource-configs/severity
- DataFuseAI. "Data Quality Validation in ETL Pipelines: The Checks That Catch What Monitoring Misses." 6 February 2026. Accessed 16 November 2026. https://www.datafuseai.com/blogs/data-quality-validation-etl-pipeline
- DataFuseAI. "Silent Data Quality: How Wrong Numbers Reach the Board." 10 February 2026. Accessed 16 November 2026. https://www.datafuseai.com/blogs/silent-data-quality-pipeline-failures
- DataFuseAI. "Data Pipeline Automation, Scheduling & Monitoring." Accessed 16 November 2026. https://www.datafuseai.com/solutions/data-pipeline-automation
- DataFuseAI. "Free 30-Day Data Integration POC." Accessed 16 November 2026. https://www.datafuseai.com/free-poc
 Request a Demo