

A data transformation is any operation that cleans, reshapes, combines, or calculates on raw data between extraction and use. In an ETL pipeline, this is the stage where messy source records become something a warehouse, dashboard, or downstream system can actually rely on. DataFuseAI handles this stage through 12 visual transformation nodes across four categories, no SQL required, though the logic underneath is the same logic any data engineer would recognize.
This guide walks through every one of those 12 nodes: what each one does, where it sits in a pipeline, and a worked input-to-output example for each using a single, consistent set of standard sample tables. For a primer on the wider ETL process this fits into, see our earlier piece explaining ETL in simple terms.
- DataFuseAI organizes transformations into four categories: Reshape (Pivot, Unpivot, Explode), Combine (Join, Union), Filter & Route (Dedupe, Filter, Split, Route), and Compute (Aggregate, Derived, Window).
- Filter and Join both support a Fuzzy Match mode, so records don't need identical spelling to combine or qualify, useful for reconciling data entered by hand across systems.
- Every node is configured through a double-click dialog on the pipeline canvas, previewed before running, and can be chained to any other node in any order.
- Aggregate and Window both compute across groups, but Aggregate collapses rows into summaries while Window keeps every row and adds a calculated column.
- Split divides a stream into exactly two branches; Route handles three or more, each with its own condition.
What Is a Data Transformation in an ETL Pipeline?
Extract, Transform, Load breaks into three stages, and transform is the middle one: data has already been pulled from a source, and it isn't in the destination yet. Whatever happens to it in between, cleaning a field, joining it to another table, rolling it up into a summary, counts as transformation.
In DataFuseAI's pipeline builder, this stage is visual rather than scripted. You drag a source node onto the canvas, drag a transformation node next to it, connect the two, and double-click the transformation to configure it. A preview pane shows the effect before you run anything for real, and the output of one transformation connects directly into the input of the next, so a pipeline is really just a chain of these nodes between a source and a sink. That chaining pattern is what section 9 of this guide walks through end to end.
Same building blocks, no code. Every transformation described below maps to an operation a data engineer would otherwise write in SQL or PySpark, DataFuseAI just replaces the script with a configuration dialog and a live preview. If you're pulling data through APIs specifically, our guide on turning API data into insights covers how these same nodes apply to that source type.
The Four Transformation Categories in DataFuseAI
Twelve nodes is a lot to hold in your head at once, so DataFuseAI groups them by what they're for rather than listing them alphabetically.
| Category | Purpose | Nodes |
|---|---|---|
| Reshape | Change the structure of the data without changing what it means | Pivot, Unpivot, Explode |
| Combine | Merge data from more than one source into a single output | Join (incl. Fuzzy Match), Union |
| Filter & Route | Select, clean, or direct specific data | Filter (incl. Fuzzy Match), Dedupe, Split, Route |
| Compute | Calculate new values, summaries, or rankings | Aggregate, Derived, Window |
The examples in every section below share one running scenario: a fictional industrial-parts distributor consolidating orders across two point-of-sale systems, a CRM, and an ERP. None of the data is real, and none of it is drawn from an actual DataFuseAI pipeline; it's a standard sample dataset built for this guide.
Reshape: Pivot, Unpivot & Explode
Reshape transformations change the layout of a table, wide to long, long to wide, or nested to flat, without changing any of the underlying values.
Reshape
Pivot
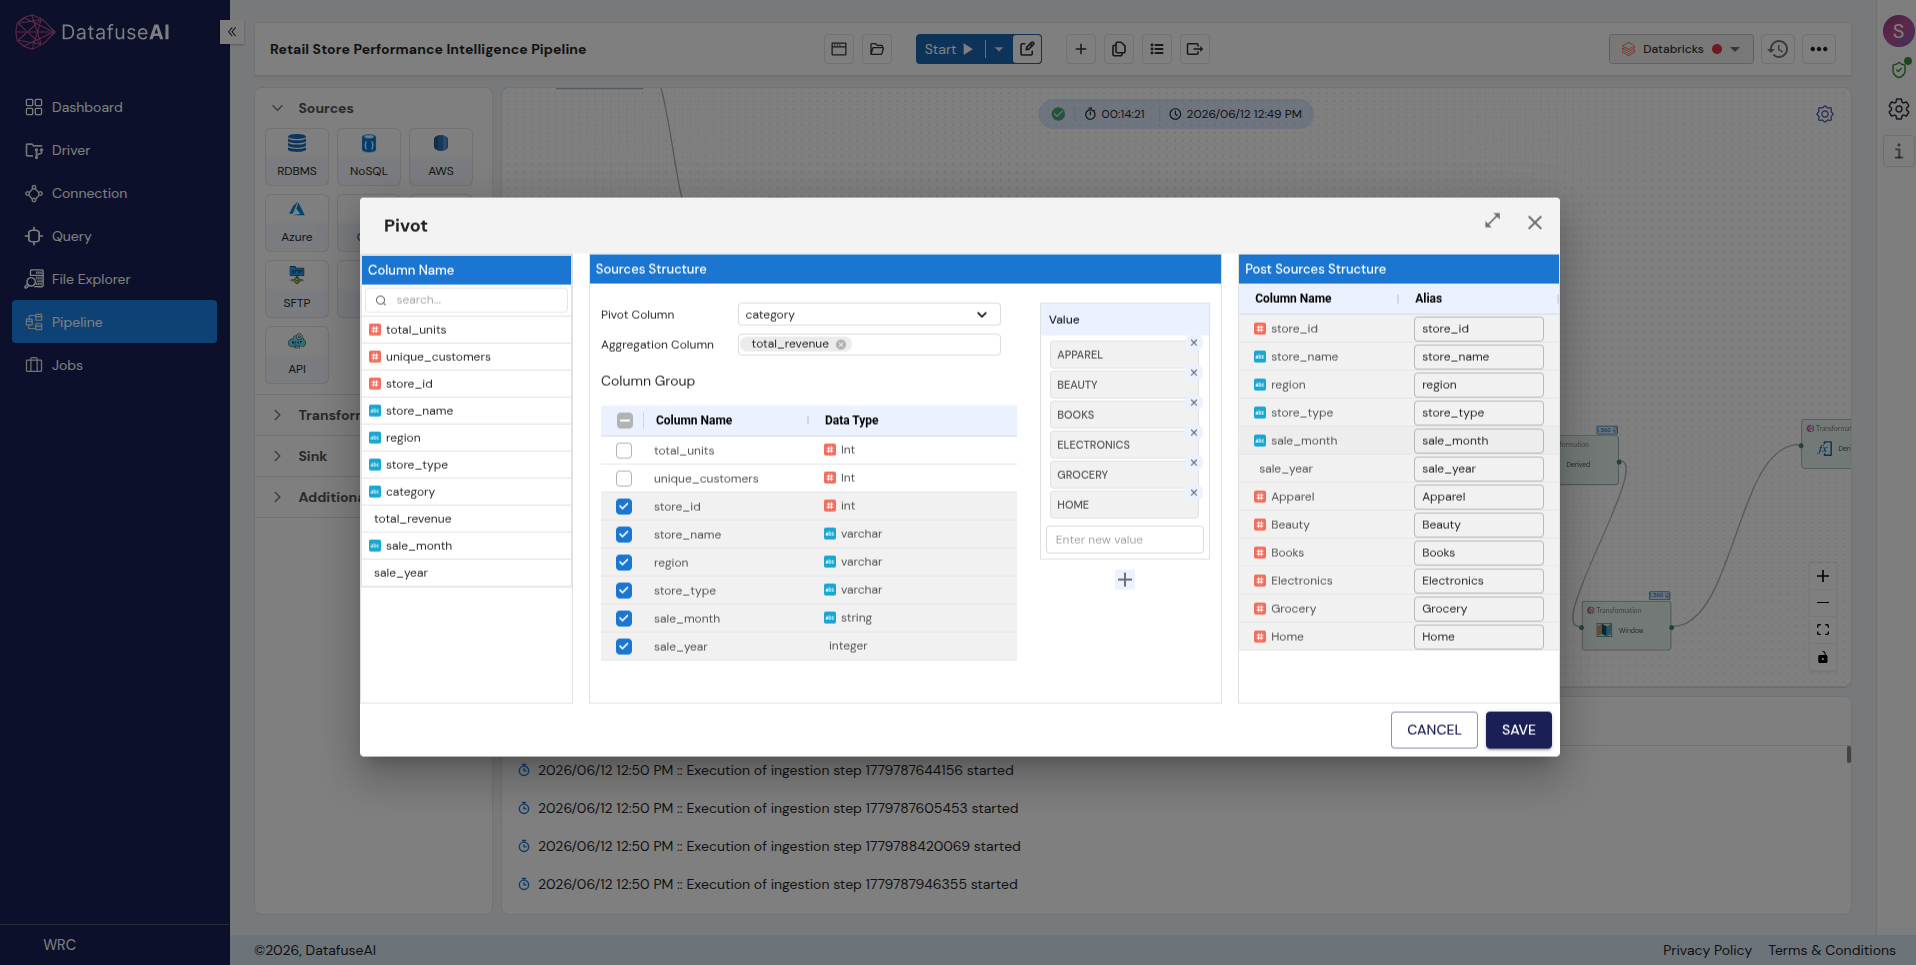
Pivot rotates unique values from one column into separate output columns, aggregating as it goes. It turns long, row-per-period data into a wide table that's easier to scan and chart.
Input — regional_revenue_long (12 rows)
| Region | Quarter | Revenue |
|---|---|---|
| North | Q1 | 48,000 |
| North | Q2 | 52,500 |
| North | Q3 | 61,000 |
| North | Q4 | 58,500 |
| South | Q1 | 39,500 |
| South | Q2 | 44,000 |
| South | Q3 | 47,500 |
| South | Q4 | 51,000 |
| East | Q1 | 33,000 |
| East | Q2 | 36,500 |
| East | Q3 | 39,000 |
| East | Q4 | 42,500 |
Configuration: Pivot Column = Quarter · Aggregation Column = Revenue · Function = sum
Output — 3 rows
| Region | Q1 | Q2 | Q3 | Q4 |
|---|---|---|---|---|
| North | 48,000 | 52,500 | 61,000 | 58,500 |
| South | 39,500 | 44,000 | 47,500 | 51,000 |
| East | 33,000 | 36,500 | 39,000 | 42,500 |
Reshape
Unpivot
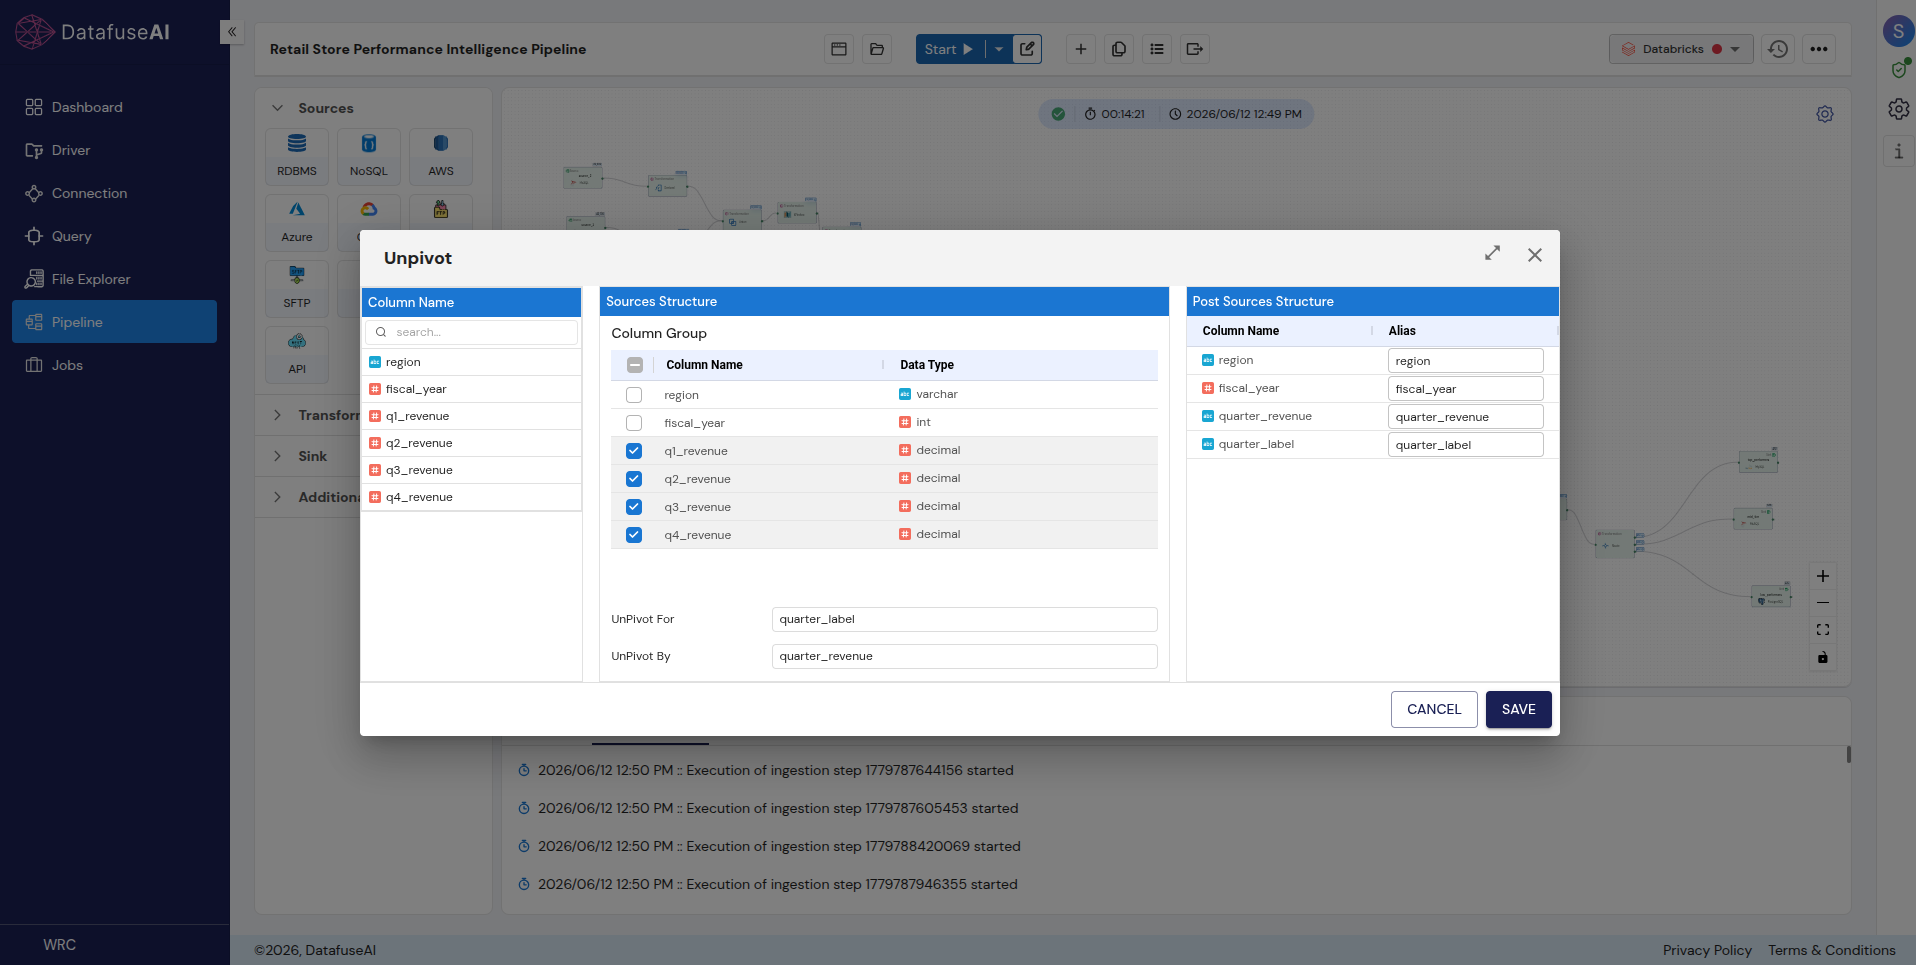
Unpivot is the reverse: it rotates columns back into rows, which is usually what a BI tool wants instead of a wide, pre-pivoted table.
Input — the pivoted table above (3 rows) · Configuration: Unpivot For = Quarter, Unpivot By = Revenue, columns Q1–Q4 selected
Output — 12 rows (identical to the original long-format table)
| Region | Quarter | Revenue |
|---|---|---|
| North | Q1 | 48,000 |
| North | Q2 | 52,500 |
| North | Q3 | 61,000 |
| North | Q4 | 58,500 |
| South | Q1 | 39,500 |
| South | Q2 | 44,000 |
| … | … | … |
| East | Q4 | 42,500 |
(all 12 rows shown in the Pivot input table above)
Reshape
Explode
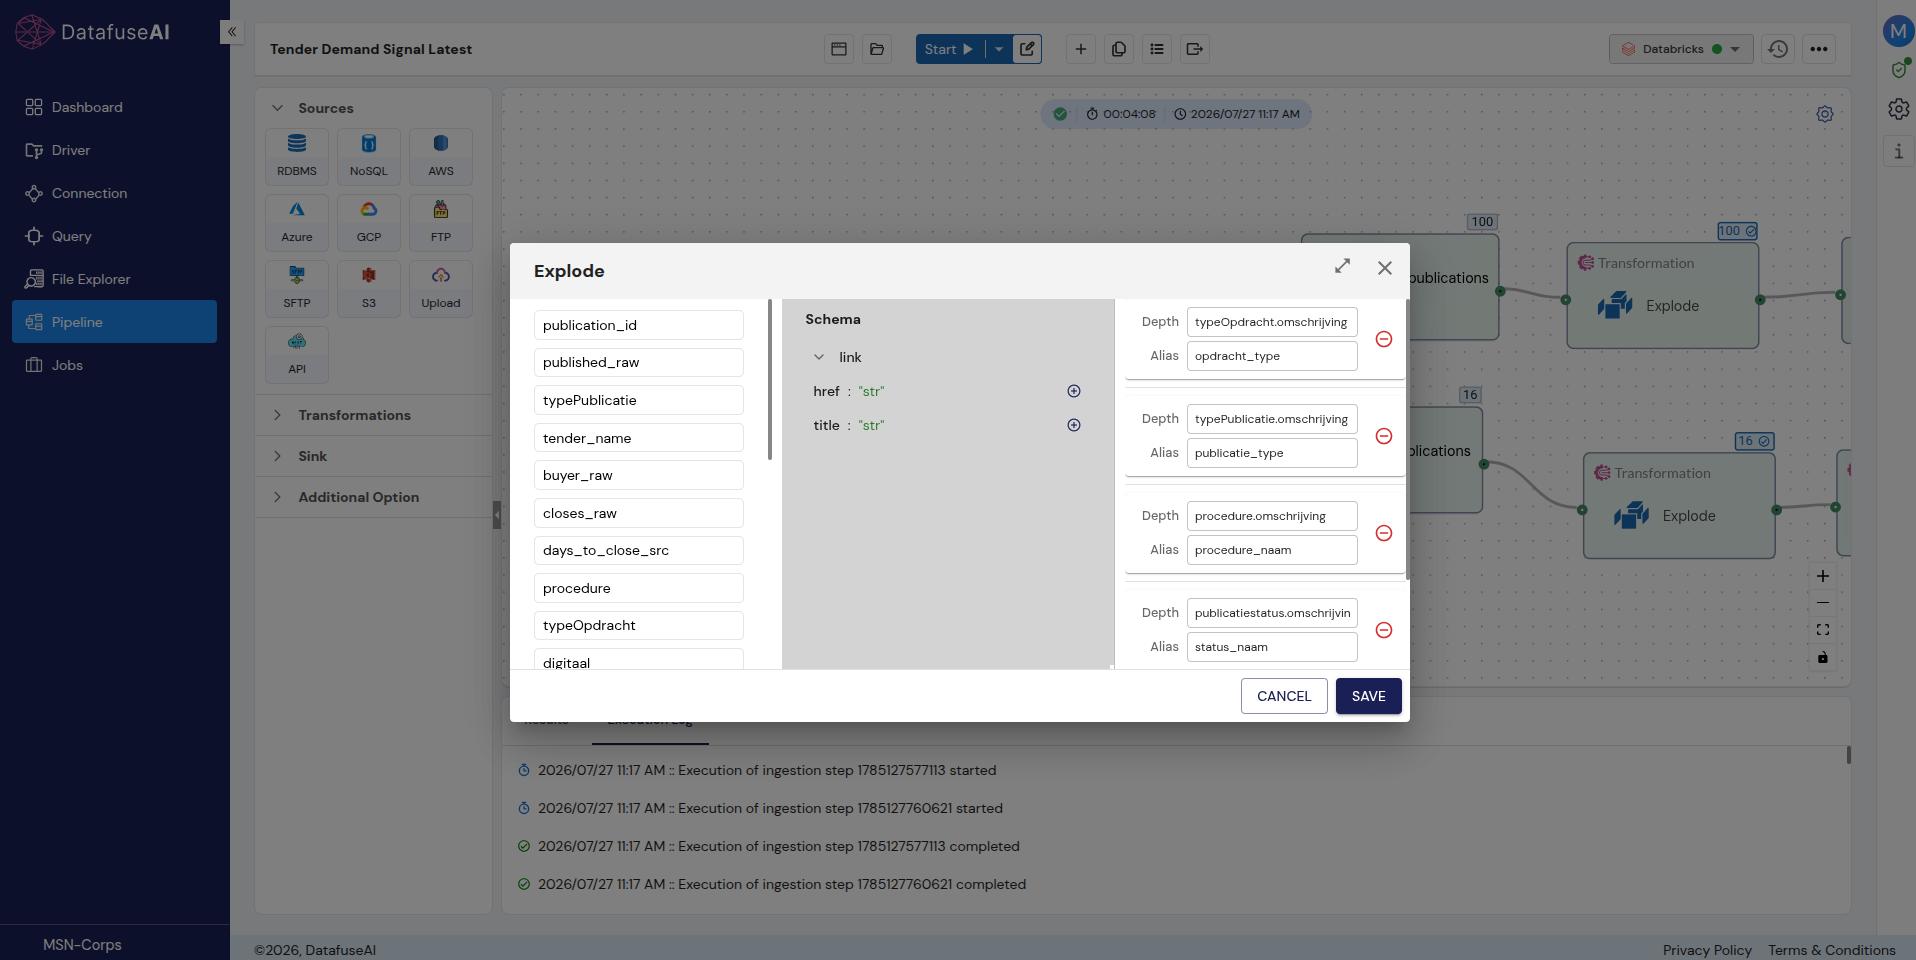
Explode flattens an array-type or nested field into one row per element, duplicating every other column for context. It's the node you reach for after an API returns a list inside a single field.
Input — orders_raw, items column (12 orders, array field)
| Order ID | Region | Items (array) |
|---|---|---|
| O1001 | North | Steel Bracket, Hex Bolt Set |
| O1002 | South | Industrial Fan |
| O1003 | East | Gasket Kit, O-Ring Pack, Sealant Tube |
| O1004 | West | Cable Tray |
| O1005 | North | Hex Bolt Set |
| O1006 | South | Pallet Jack, Shrink Wrap |
| O1007 | East | Air Compressor |
| O1008 | East | Gasket Kit, Bearing Set |
| O1009 | West | Weld Rod Box |
| O1010 | West | Cable Tray |
| O1011 | North | CNC Blade Set, Coolant Drum |
| O1012 | East | Air Compressor, Filter Cartridge |
Configuration: Array Column = items · New Column Name = item
Output — 19 rows (one per item, all other columns duplicated)
| Order ID | Region | Item |
|---|---|---|
| O1001 | North | Steel Bracket |
| O1001 | North | Hex Bolt Set |
| O1002 | South | Industrial Fan |
| O1003 | East | Gasket Kit |
| O1003 | East | O-Ring Pack |
| O1003 | East | Sealant Tube |
| O1004 | West | Cable Tray |
| O1005 | North | Hex Bolt Set |
| O1006 | South | Pallet Jack |
| O1006 | South | Shrink Wrap |
| O1007 | East | Air Compressor |
| O1008 | East | Gasket Kit |
| O1008 | East | Bearing Set |
| O1009 | West | Weld Rod Box |
| O1010 | West | Cable Tray |
| O1011 | North | CNC Blade Set |
| O1011 | North | Coolant Drum |
| O1012 | East | Air Compressor |
| O1012 | East | Filter Cartridge |
Combine: Join, Fuzzy Join & Union
Combine transformations bring together data from more than one source, either by matching keys across tables or by stacking rows with the same shape.
Combine
Join
Join merges two sources on a matching key. DataFuseAI supports the standard set of join types, and which one you pick changes exactly which rows survive.
Input A — orders (12 rows, from the Explode example above, customer_id added)
| Order ID | Customer ID | Region | Amount | Status |
|---|---|---|---|---|
| O1001 | C001 | North | 420.00 | Shipped |
| O1002 | C002 | South | 1,180.50 | Shipped |
| O1003 | C003 | East | 95.00 | Pending |
| O1004 | C004 | West | 275.00 | Shipped |
| O1005 | C001 | North | 60.00 | Cancelled |
| O1006 | C005 | South | 890.00 | Shipped |
| O1007 | C006 | East | 340.00 | Returned |
| O1008 | C003 | East | 610.00 | Shipped |
| O1009 | C007 | West | 150.00 | Shipped |
| O1010 | C004 | West | 45.00 | Pending |
| O1011 | C008 | North | 1,320.00 | Shipped |
| O1012 | C006 | East | 480.00 | Shipped |
Input B — customers (10 rows; C009 and C010 have no orders)
| Customer ID | Customer Name | City | Segment |
|---|---|---|---|
| C001 | Meridian Traders Ltd | Denver | Wholesale |
| C002 | Alderbrook Supply Co | Columbus | Wholesale |
| C003 | Continental Parts Inc | Pittsburgh | Manufacturing |
| C004 | Blue Ridge Hardware | Asheville | Retail |
| C005 | Northstar Logistics | Memphis | Logistics |
| C006 | Coastal Equipment Group | Savannah | Manufacturing |
| C007 | Prairie Fabricators | Omaha | Manufacturing |
| C008 | Vantage Metal Works | Tulsa | Manufacturing |
| C009 | Summit Rail Supply | Boise | Wholesale |
| C010 | Harbor Fastener Co | Portland | Retail |
Output — Inner Join on Customer ID (12 rows)
| Order ID | Customer ID | Amount | Status | City | Segment |
|---|---|---|---|---|---|
| O1001 | C001 | 420.00 | Shipped | Denver | Wholesale |
| O1002 | C002 | 1,180.50 | Shipped | Columbus | Wholesale |
| O1003 | C003 | 95.00 | Pending | Pittsburgh | Manufacturing |
| O1004 | C004 | 275.00 | Shipped | Asheville | Retail |
| O1005 | C001 | 60.00 | Cancelled | Denver | Wholesale |
| O1006 | C005 | 890.00 | Shipped | Memphis | Logistics |
| O1007 | C006 | 340.00 | Returned | Savannah | Manufacturing |
| O1008 | C003 | 610.00 | Shipped | Pittsburgh | Manufacturing |
| O1009 | C007 | 150.00 | Shipped | Omaha | Manufacturing |
| O1010 | C004 | 45.00 | Pending | Asheville | Retail |
| O1011 | C008 | 1,320.00 | Shipped | Tulsa | Manufacturing |
| O1012 | C006 | 480.00 | Shipped | Savannah | Manufacturing |
How row counts change by join type, on this exact dataset
| Join Type | Description | Row Count Here |
|---|---|---|
| Inner | Only rows with a match on both sides | 12 |
| Left Outer | All orders, matched customer data where it exists | 12 |
| Right Outer | All customers, matched orders where they exist, repeated per order | 14 |
| Full Outer | Every order and every customer, matched where possible | 14 |
| Left Semi | Order columns only, for orders with a matching customer | 12 |
| Left Anti | Orders with no matching customer | 0 |
| Cross | Every order paired with every customer (cartesian) | 120 |
Right Outer lands at 14 rather than 10 because C001, C003, C004, and C006 each placed two orders, so they appear twice; C009 and C010 still appear once each with null order fields. That's the detail that trips people up when they assume "outer join" just means "add the missing rows."
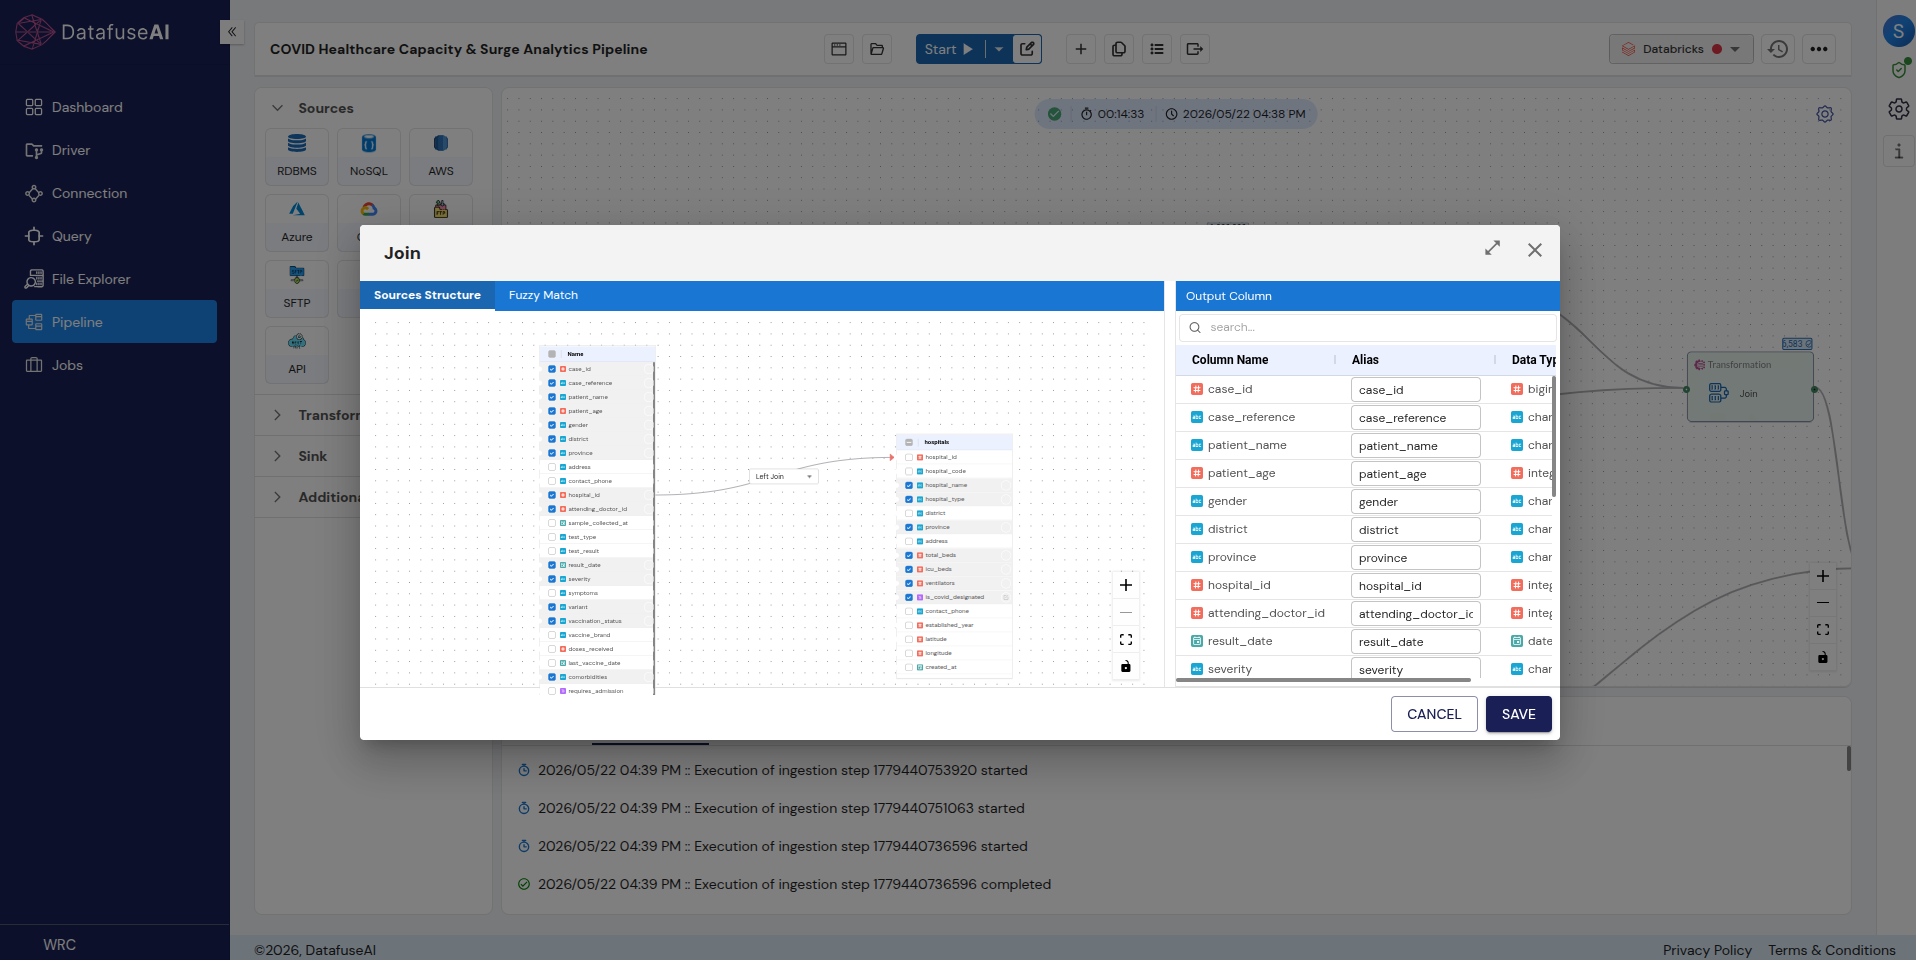
Combine · Fuzzy Match
Fuzzy Join
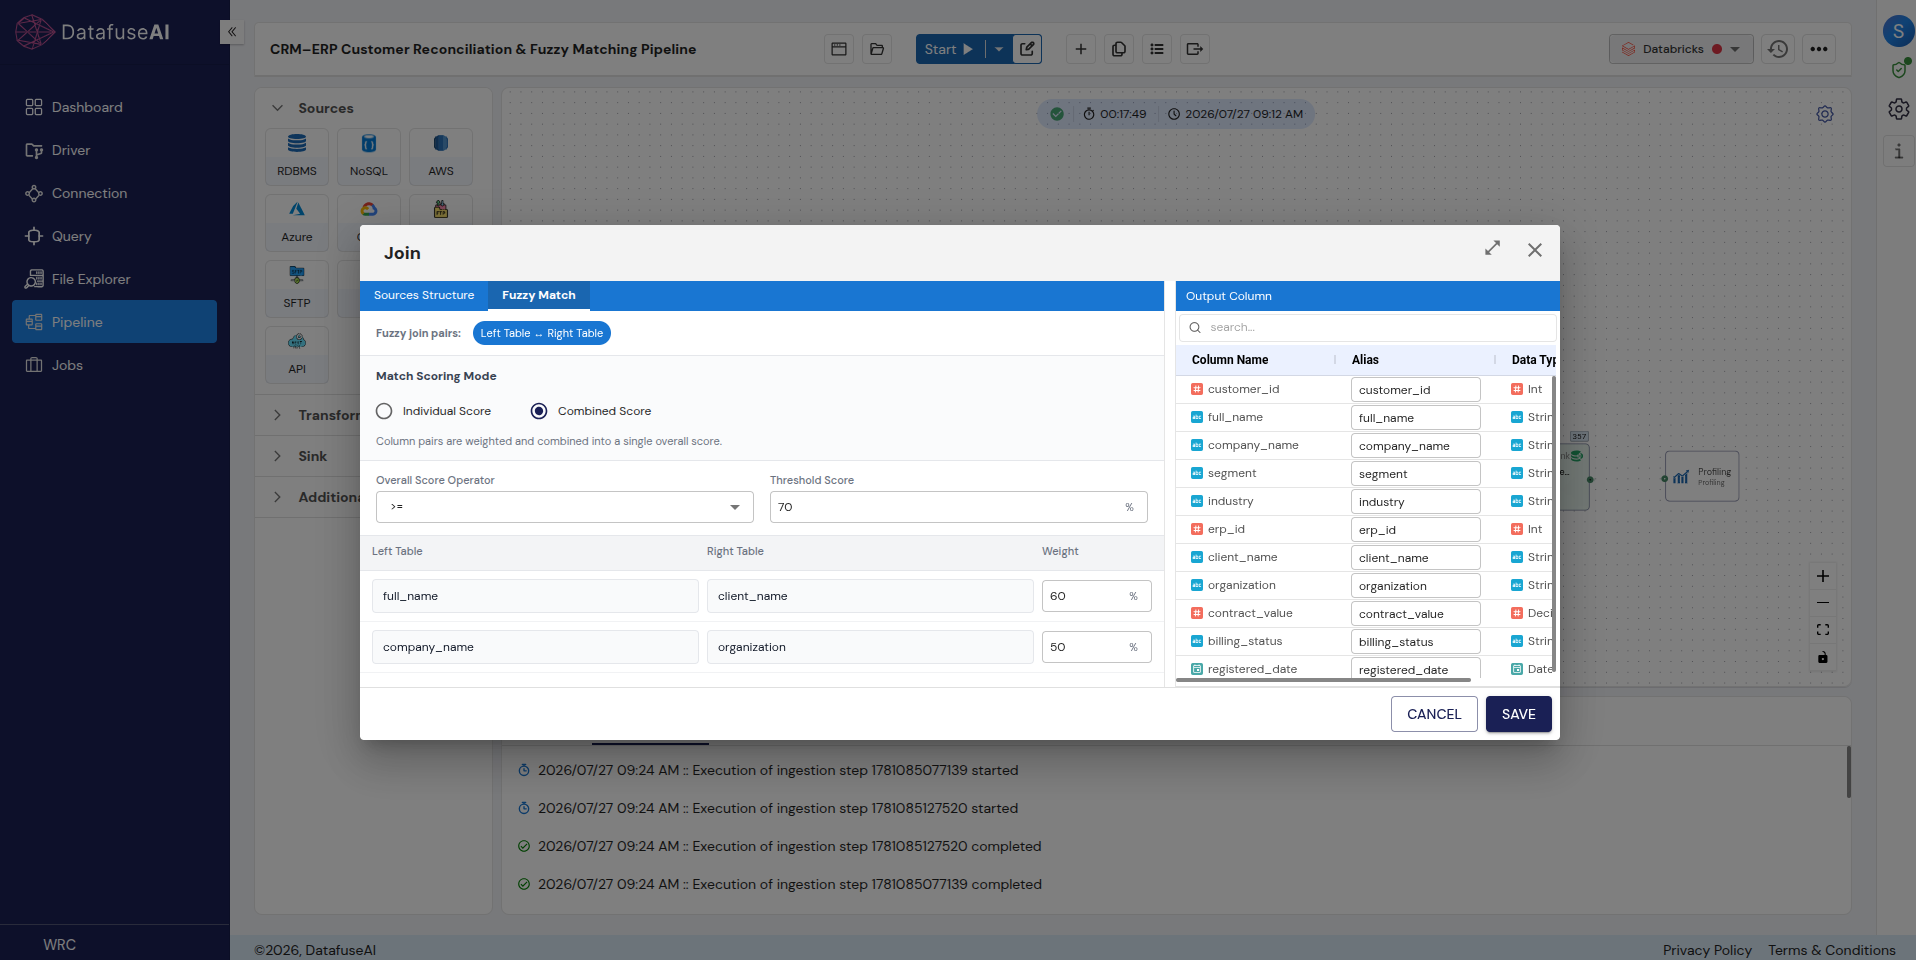
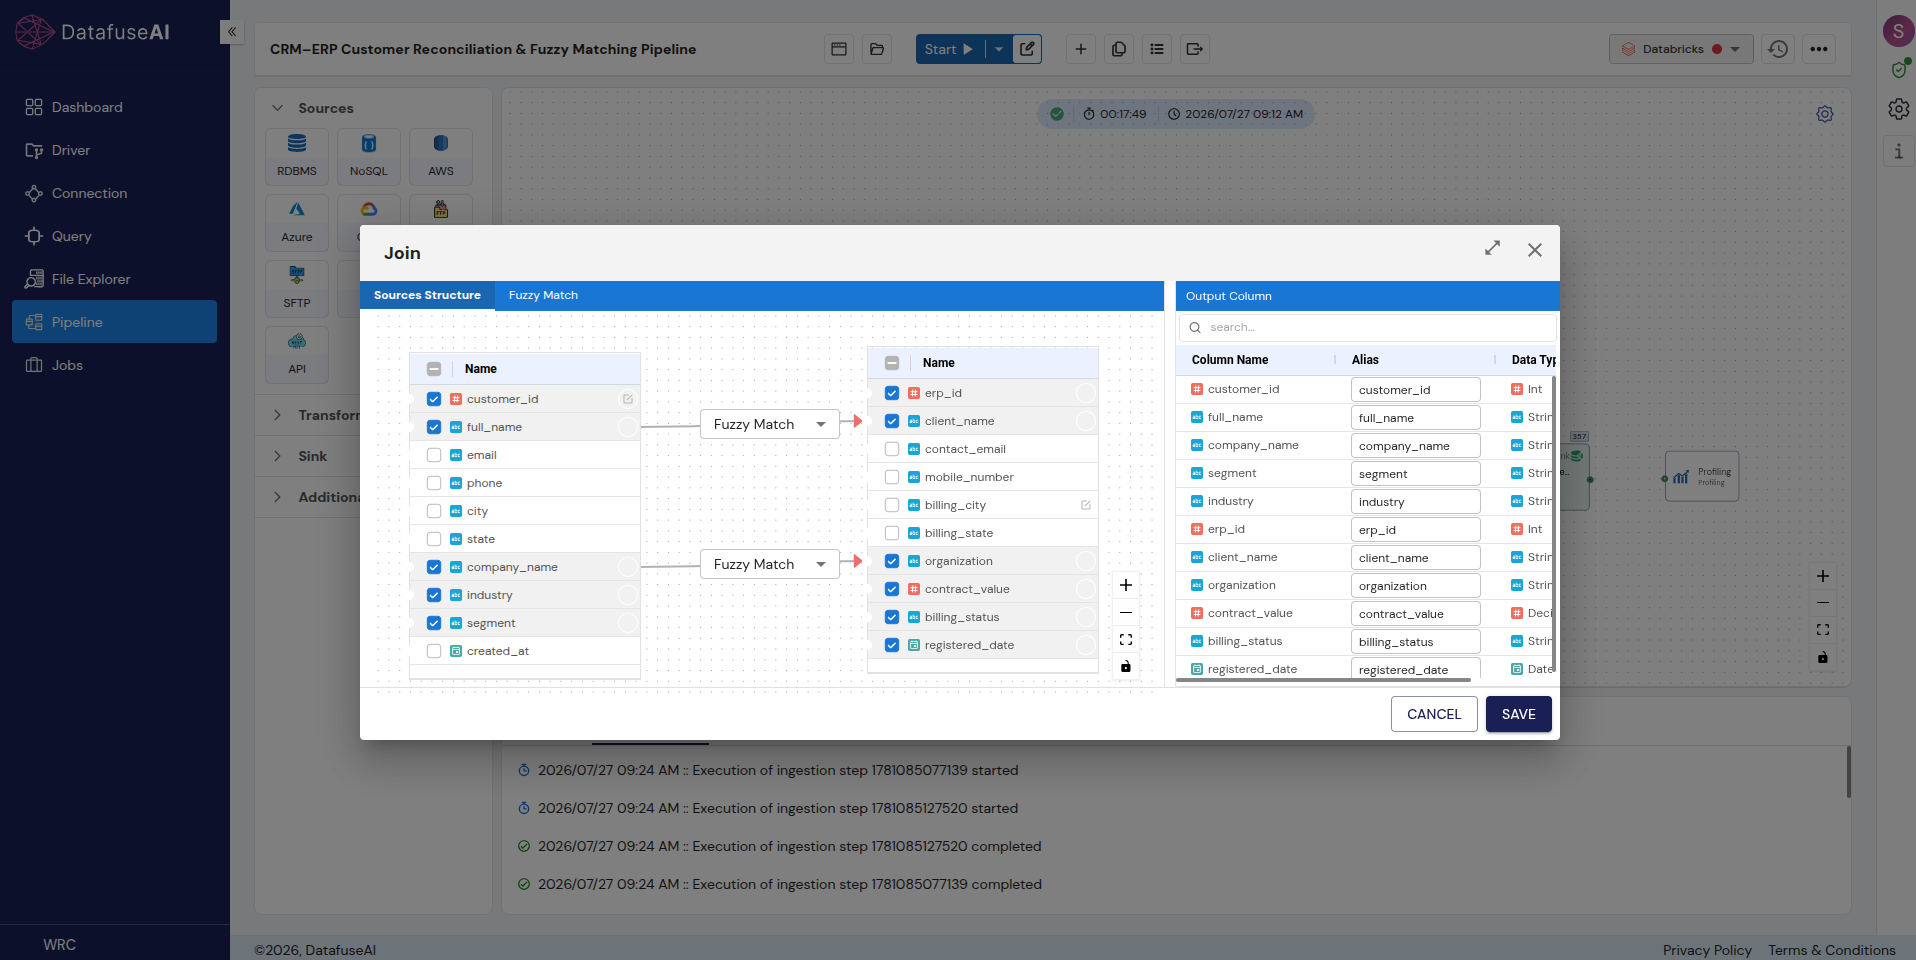
Fuzzy Join is the same idea as Join, except the match key doesn't need to be identical on both sides. Instead, DataFuseAI scores how similar two text values are and accepts pairs above a threshold you set, which is what makes it possible to reconcile a CRM's freehand company names against an ERP's canonical customer list. For more on how the scoring itself works, see our dedicated guide to fuzzy matching in ETL pipelines.
Input — crm_contacts (12 rows, freehand company names)
| Contact ID | Organization | City |
|---|---|---|
| CR001 | Meridian Traders Ltd | Denver |
| CR002 | Meridian Trading Ltd | Denver |
| CR003 | Meridian Traders LLC | Denver |
| CR004 | Meridian Traiders Ltd | Denver |
| CR005 | Alderbrook Supply Co | Columbus |
| CR006 | Alderbrook Supplies Company | Columbus |
| CR007 | Continental Parts Incorporated | Pittsburgh |
| CR008 | Continental Part Inc | Pittsburgh |
| CR009 | Coastal Equipmnt Group | Savannah |
| CR010 | Coastal Equipment Grp | Savannah |
| CR011 | Vantage Metal Werks | Tulsa |
| CR012 | Harbor Fastener Co | Portland |
Configuration: Organization ≈ Customer Name · Combined Score ≥ 70%, weighted · matched against the customers table above
Output — 12 rows, every contact resolved to a canonical customer (scores illustrative)
| Contact ID | Organization (CRM) | Matched Customer | Score |
|---|---|---|---|
| CR001 | Meridian Traders Ltd | C001 — Meridian Traders Ltd | 100% |
| CR002 | Meridian Trading Ltd | C001 — Meridian Traders Ltd | 82% |
| CR003 | Meridian Traders LLC | C001 — Meridian Traders Ltd | 78% |
| CR004 | Meridian Traiders Ltd | C001 — Meridian Traders Ltd | 88% |
| CR005 | Alderbrook Supply Co | C002 — Alderbrook Supply Co | 100% |
| CR006 | Alderbrook Supplies Company | C002 — Alderbrook Supply Co | 84% |
| CR007 | Continental Parts Incorporated | C003 — Continental Parts Inc | 89% |
| CR008 | Continental Part Inc | C003 — Continental Parts Inc | 92% |
| CR009 | Coastal Equipmnt Group | C006 — Coastal Equipment Group | 90% |
| CR010 | Coastal Equipment Grp | C006 — Coastal Equipment Group | 93% |
| CR011 | Vantage Metal Werks | C008 — Vantage Metal Works | 91% |
| CR012 | Harbor Fastener Co | C010 — Harbor Fastener Co | 100% |
Combine
Union
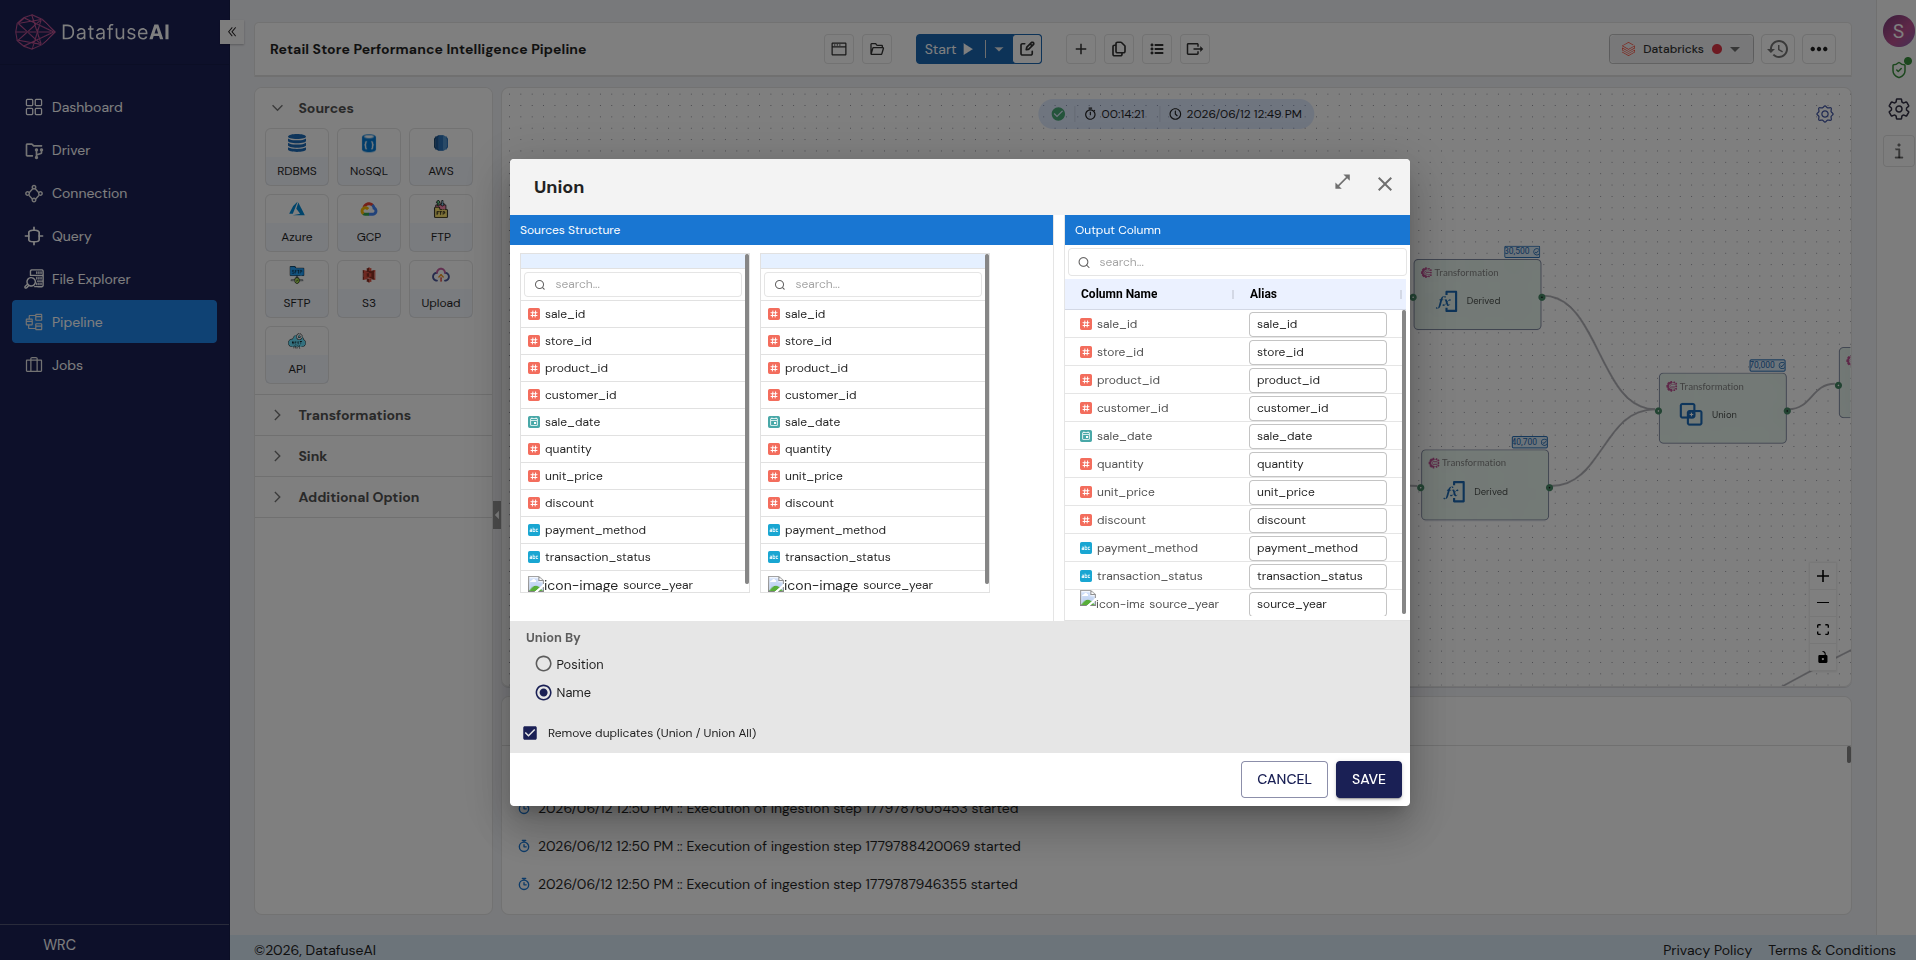
Union stacks rows from two or more sources that share the same schema. It doesn't match on a key, it simply appends, which makes it the right tool when two systems produce the same kind of record rather than related records.
Input A — orders_store_a, legacy POS (10 rows)
| Customer Name | Region | Amount | Status |
|---|---|---|---|
| Meridian Traders Ltd | North | 420.00 | Shipped |
| Continental Parts Inc | East | 95.00 | Pending |
| Coastal Equipment Group | East | 340.00 | Returned |
| Vantage Metal Works | North | 1,320.00 | Shipped |
| Continental Parts Inc | East | 610.00 | Shipped |
| Coastal Equipment Group | East | 480.00 | Shipped |
| Meridian Traders Ltd | North | 60.00 | Cancelled |
| Summit Rail Supply | North | 220.00 | Shipped |
| Continental Parts Inc | East | 75.00 | Pending |
| Vantage Metal Works | North | 990.00 | Shipped |
Input B — orders_store_b, cloud POS (10 rows; rows 7 & 8 duplicate Input A)
| Customer Name | Region | Amount | Status |
|---|---|---|---|
| Alderbrook Supply Co | South | 1,180.50 | Shipped |
| Northstar Logistics | South | 890.00 | Shipped |
| Blue Ridge Hardware | West | 275.00 | Shipped |
| Prairie Fabricators | West | 150.00 | Shipped |
| Blue Ridge Hardware | West | 45.00 | Pending |
| Harbor Fastener Co | West | 310.00 | Shipped |
| Vantage Metal Works | North | 1,320.00 | Shipped |
| Meridian Traders Ltd | North | 420.00 | Shipped |
| Northstar Logistics | South | 500.00 | Pending |
| Alderbrook Supply Co | South | 90.00 | Cancelled |
Highlighted rows are exact duplicates of two rows in Input A
Union All (duplicates retained): 20 rows. Union Distinct (Remove Duplicates checked): 18 rows, the two highlighted duplicate rows collapse into one each. This is also where multi-source data conflicts tend to surface, since union only catches duplicates that are byte-for-byte identical; near-duplicates need Dedupe or Fuzzy Match instead.
Filtering & Deduplication: Filter, Fuzzy Filter & Dedupe
These three nodes are about what stays in the dataset: rows that meet a condition, rows that approximately match a value, and rows that aren't repeats of something already there.
Filter & Route
Filter
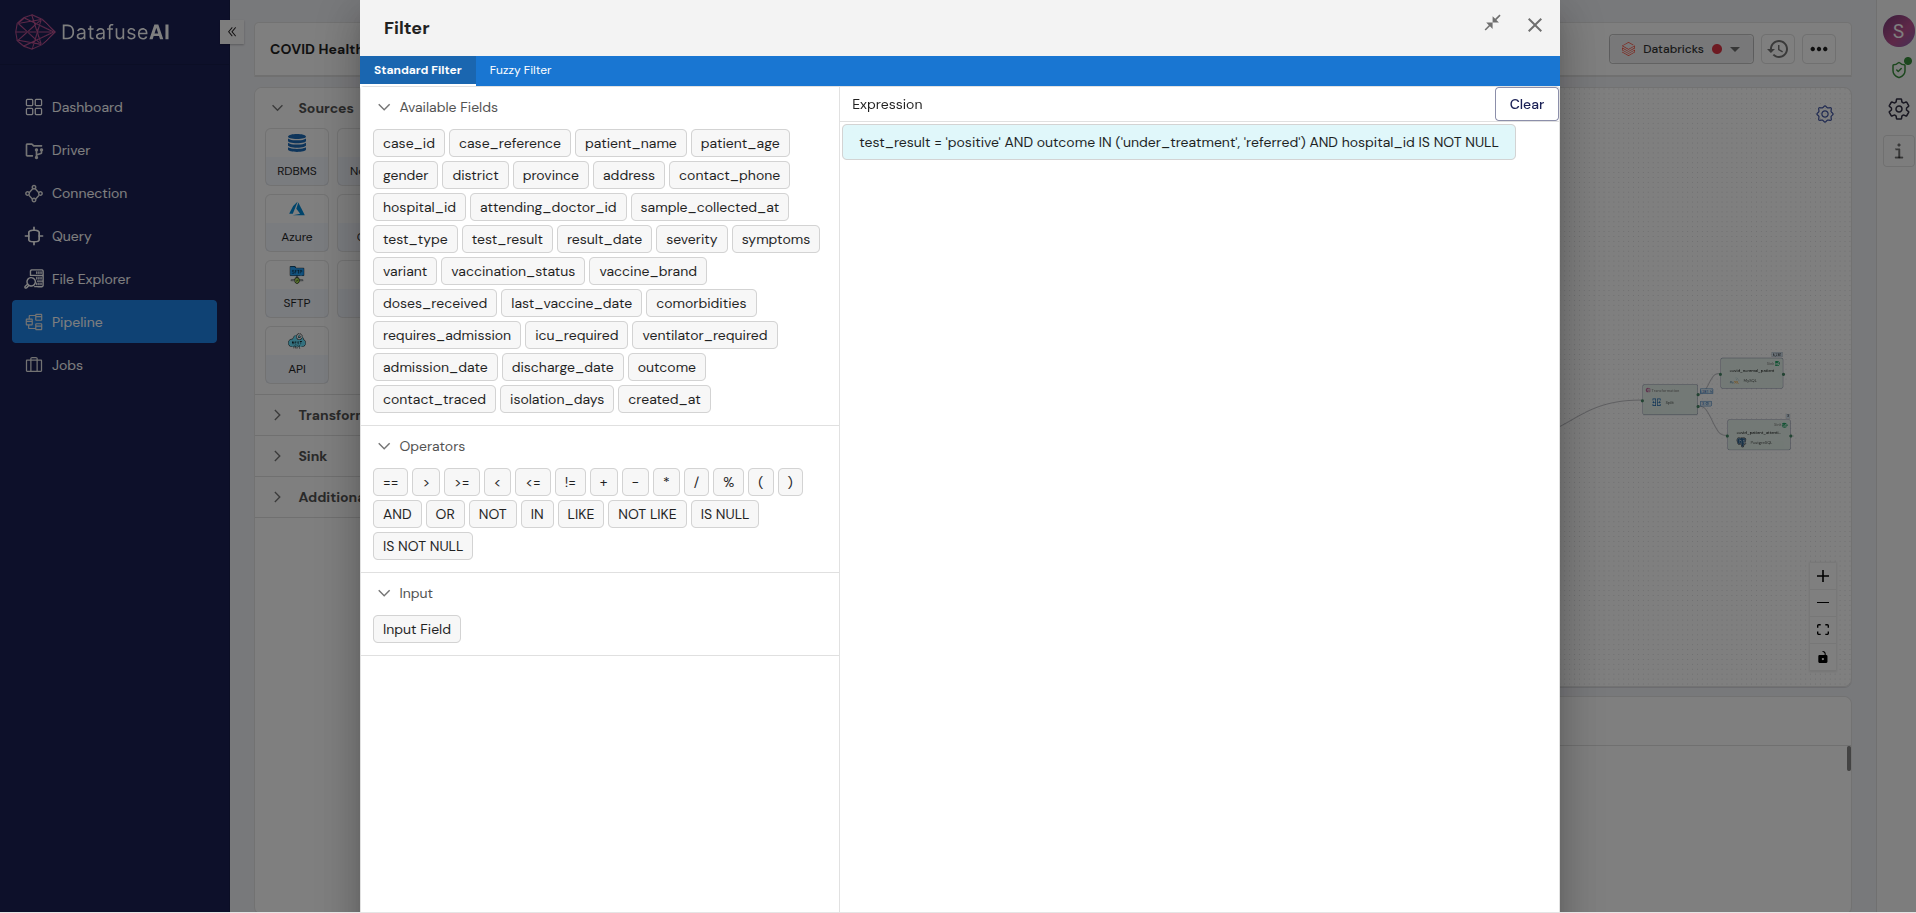
Filter keeps only the rows that satisfy an expression, built from available fields, comparison operators, and logical operators, similar to a SQL WHERE clause.
Input — clean_orders (12 rows, the deduped set from below)
| Order ID | Region | Status | Amount |
|---|---|---|---|
| O1001 | North | Shipped | 420.00 |
| O1002 | South | Shipped | 1,180.50 |
| O1003 | East | Pending | 95.00 |
| O1004 | West | Shipped | 275.00 |
| O1005 | North | Cancelled | 60.00 |
| O1006 | South | Shipped | 890.00 |
| O1007 | East | Returned | 340.00 |
| O1008 | East | Shipped | 610.00 |
| O1009 | West | Shipped | 150.00 |
| O1010 | West | Pending | 45.00 |
| O1011 | North | Shipped | 1,320.00 |
| O1012 | East | Shipped | 480.00 |
Expression: status == 'Shipped' AND amount >= 300
Output — 6 rows
| Order ID | Region | Status | Amount |
|---|---|---|---|
| O1001 | North | Shipped | 420.00 |
| O1002 | South | Shipped | 1,180.50 |
| O1006 | South | Shipped | 890.00 |
| O1008 | East | Shipped | 610.00 |
| O1011 | North | Shipped | 1,320.00 |
| O1012 | East | Shipped | 480.00 |
Filter & Route · Fuzzy Match
Fuzzy Filter
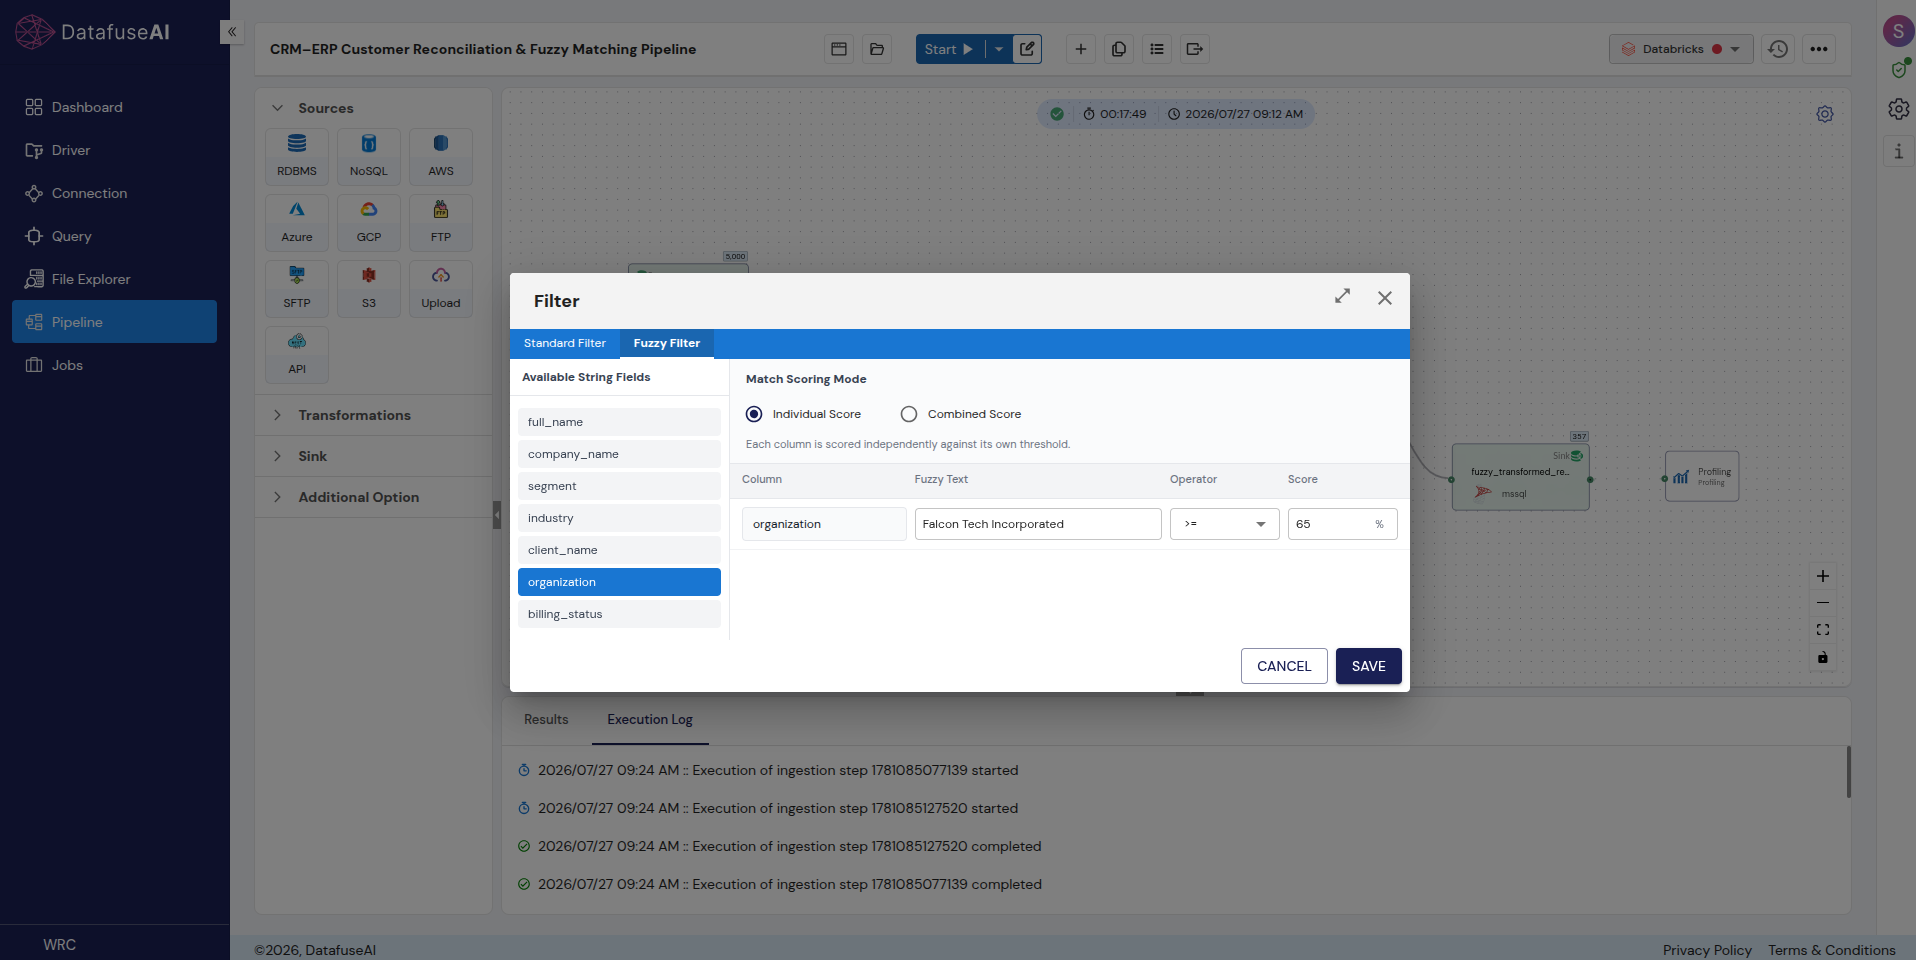
Fuzzy Filter applies the same similarity scoring as Fuzzy Join, but as a standalone condition rather than a merge, useful for isolating records that probably refer to one specific entity without an exact-match key.
Input — crm_contacts (same 12 rows as the Fuzzy Join example)
Condition: Organization fuzzy-matches "Meridian Traders Ltd" · Score ≥ 65% (scores illustrative)
| Contact ID | Organization | Similarity Score | Result |
|---|---|---|---|
| CR001 | Meridian Traders Ltd | 100% | Pass |
| CR002 | Meridian Trading Ltd | 82% | Pass |
| CR003 | Meridian Traders LLC | 78% | Pass |
| CR004 | Meridian Traiders Ltd | 88% | Pass |
| CR005 | Alderbrook Supply Co | 12% | Fail |
| CR006 | Alderbrook Supplies Company | 15% | Fail |
| CR007 | Continental Parts Incorporated | 8% | Fail |
| CR008 | Continental Part Inc | 9% | Fail |
| CR009 | Coastal Equipmnt Group | 6% | Fail |
| CR010 | Coastal Equipment Grp | 7% | Fail |
| CR011 | Vantage Metal Werks | 5% | Fail |
| CR012 | Harbor Fastener Co | 4% | Fail |
Output: 4 rows (CR001–CR004). For a closer look at how similarity scoring, thresholds, and weighting actually work under the hood, our fuzzy matching guide covers the algorithms directly.
Filter & Route
Dedupe
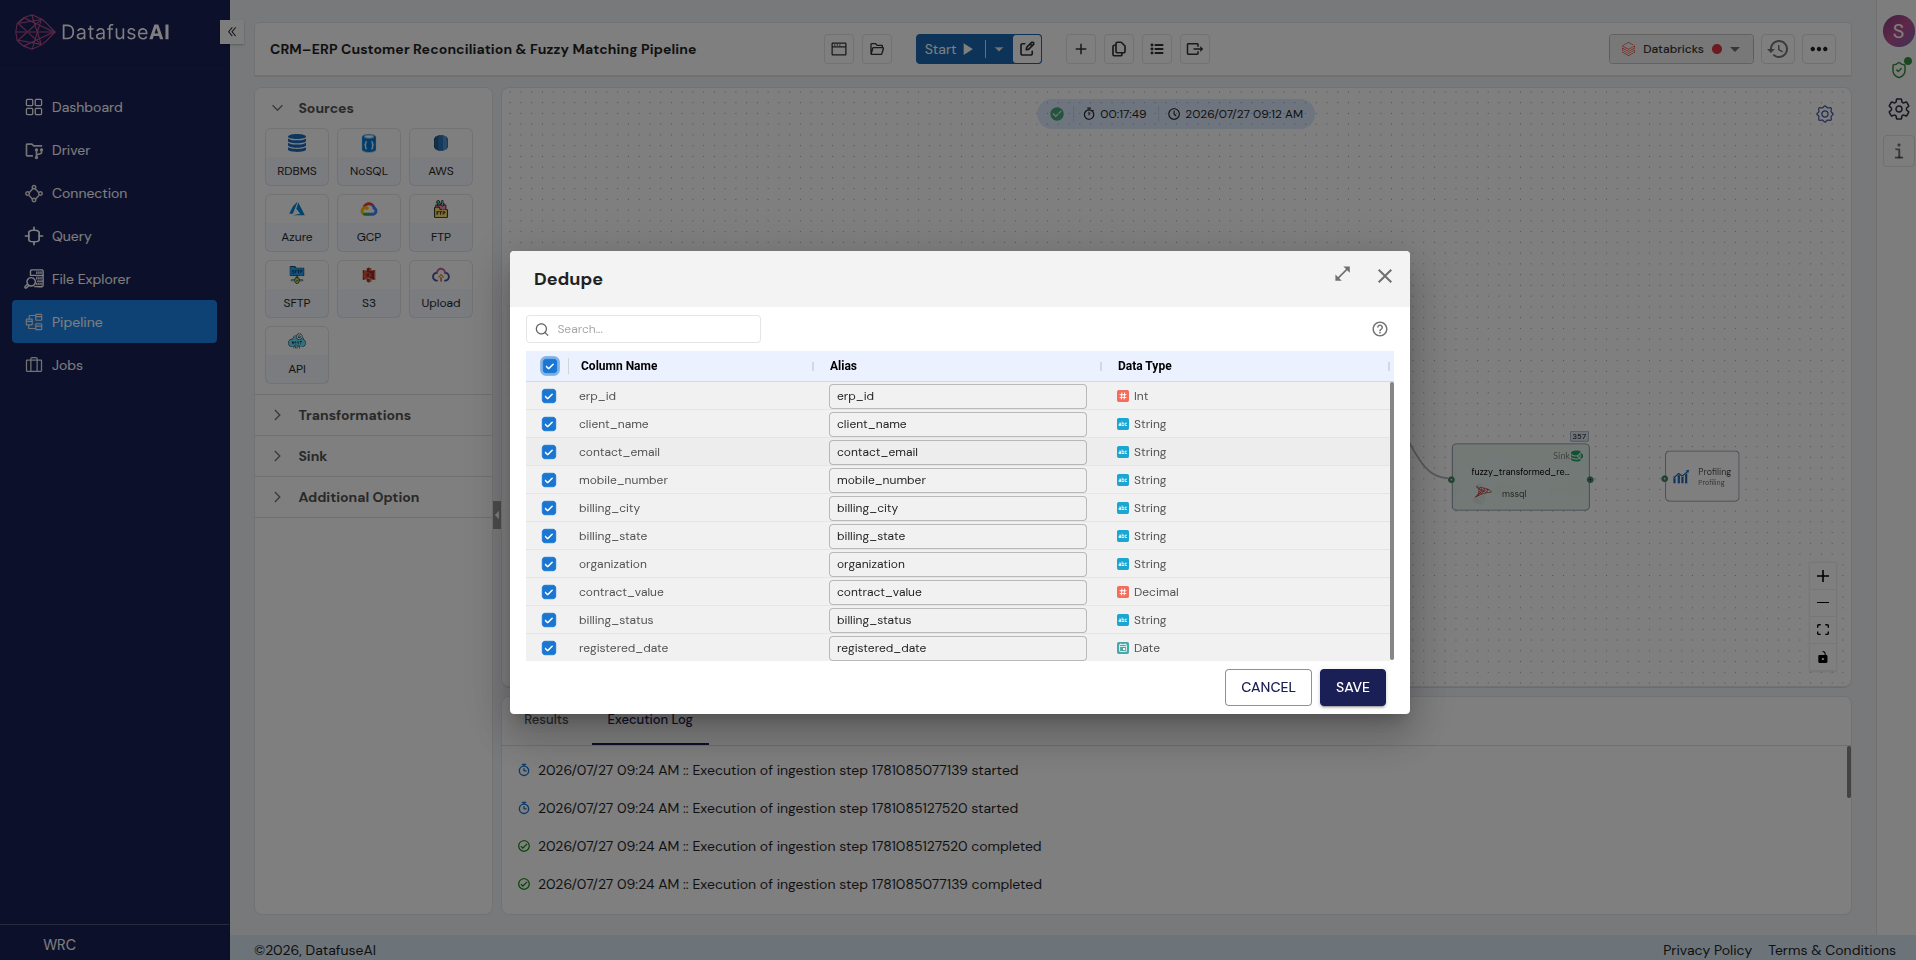
Dedupe removes duplicate rows, either across every column or a chosen subset, keeping the first occurrence of each unique combination. It's usually one of the first nodes in a pipeline, since it's hard to trust anything downstream if the same record entered twice.
Input — orders_raw (14 rows; two exact duplicates highlighted)
| Order ID | Customer Name | Region | Status | Amount |
|---|---|---|---|---|
| O1001 | Meridian Traders Ltd | North | Shipped | 420.00 |
| O1002 | Alderbrook Supply Co | South | Shipped | 1,180.50 |
| O1003 | Continental Parts Inc | East | Pending | 95.00 |
| O1004 | Blue Ridge Hardware | West | Shipped | 275.00 |
| O1005 | Meridian Traders Ltd | North | Cancelled | 60.00 |
| O1006 | Northstar Logistics | South | Shipped | 890.00 |
| O1002 | Alderbrook Supply Co | South | Shipped | 1,180.50 |
| O1007 | Coastal Equipment Group | East | Returned | 340.00 |
| O1008 | Continental Parts Inc | East | Shipped | 610.00 |
| O1009 | Prairie Fabricators | West | Shipped | 150.00 |
| O1006 | Northstar Logistics | South | Shipped | 890.00 |
| O1010 | Blue Ridge Hardware | West | Pending | 45.00 |
| O1011 | Vantage Metal Works | North | Shipped | 1,320.00 |
| O1012 | Coastal Equipment Group | East | Shipped | 480.00 |
Configuration: Dedupe on all columns · Output — 12 rows (this is the clean_orders table used throughout this guide)
Every node from here forward, Filter, Split, Route, Aggregate, Derived, and Window, uses this same 12-row deduped table as its input, the way a real pipeline would chain them. For a broader look at catching this kind of issue before it reaches a warehouse, see data quality validation in ETL pipelines.
Routing & Splitting: Split & Route
Split and Route both divide one stream into multiple branches. The difference is how many branches they support.
Filter & Route
Split
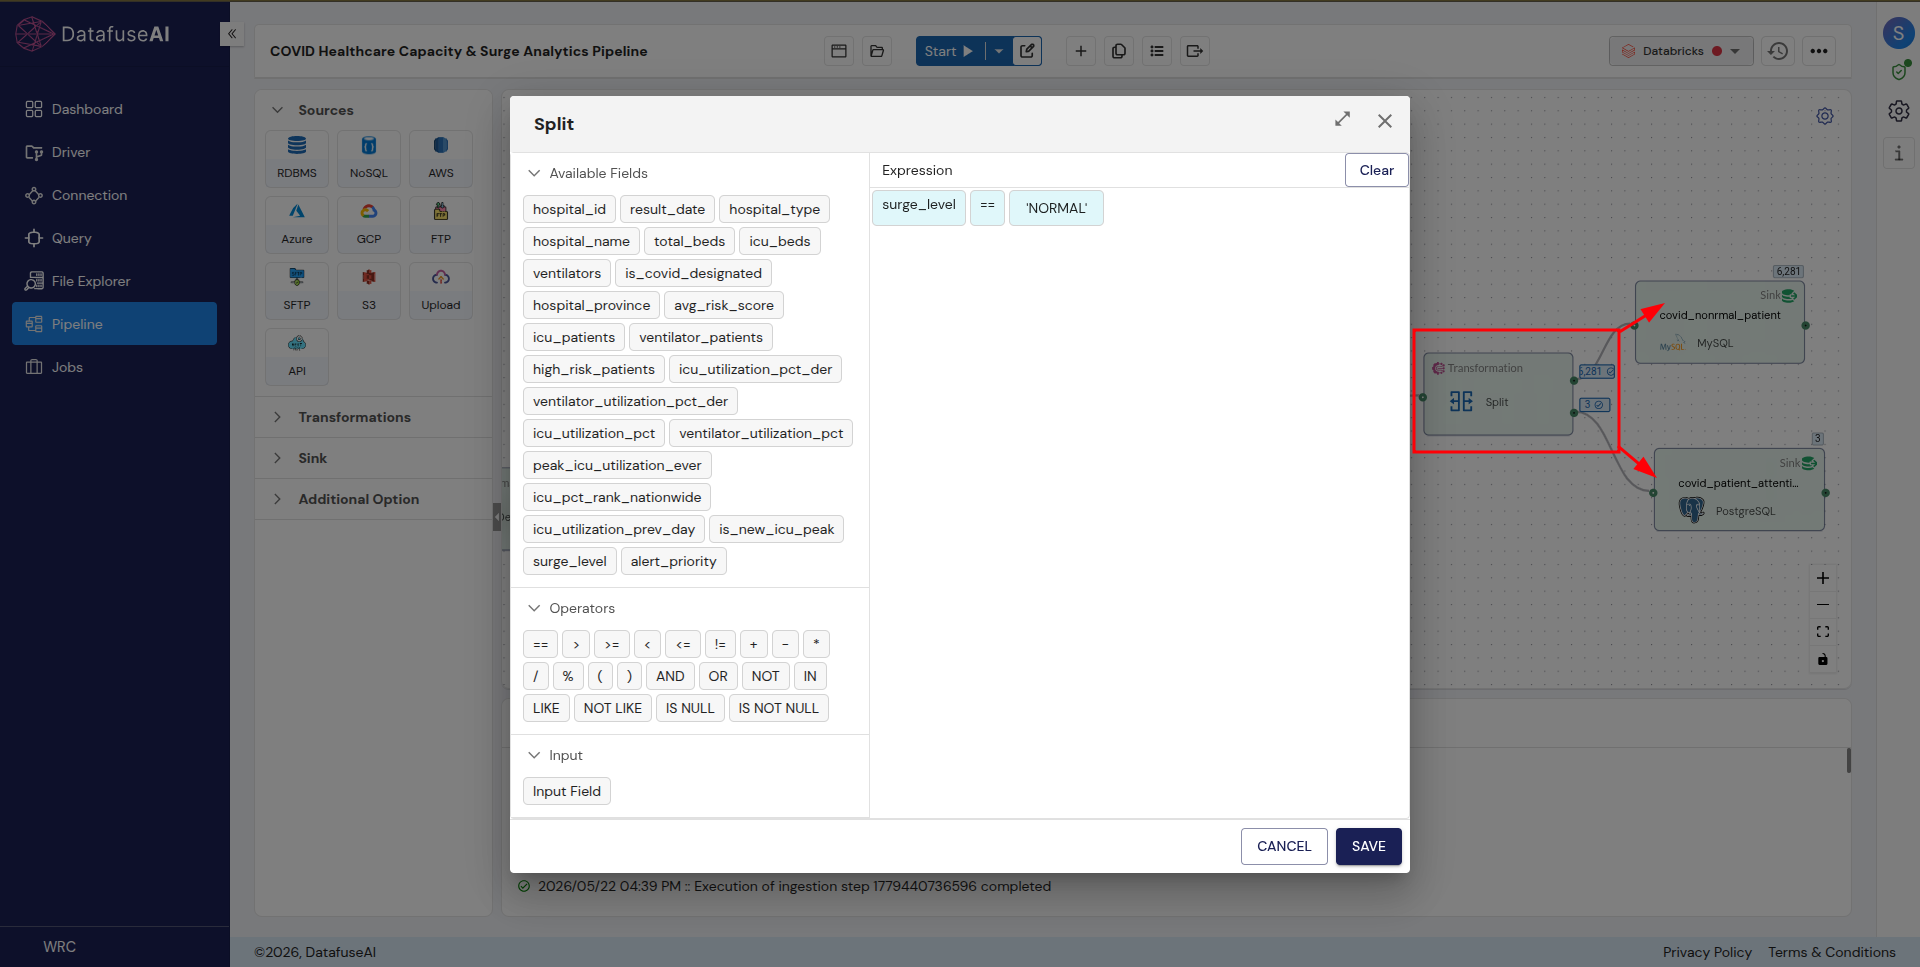
Split evaluates one condition and sends every row down one of exactly two paths: a true branch and a false branch. Both outputs keep the full original schema.
Input — clean_orders (12 rows) · Condition: amount >= 300
| Order ID | Region | Amount | Branch |
|---|---|---|---|
| O1001 | North | 420.00 | Output 1 (≥ 300) |
| O1002 | South | 1,180.50 | Output 1 (≥ 300) |
| O1003 | East | 95.00 | Output 2 (< 300) |
| O1004 | West | 275.00 | Output 2 (< 300) |
| O1005 | North | 60.00 | Output 2 (< 300) |
| O1006 | South | 890.00 | Output 1 (≥ 300) |
| O1007 | East | 340.00 | Output 1 (≥ 300) |
| O1008 | East | 610.00 | Output 1 (≥ 300) |
| O1009 | West | 150.00 | Output 2 (< 300) |
| O1010 | West | 45.00 | Output 2 (< 300) |
| O1011 | North | 1,320.00 | Output 1 (≥ 300) |
| O1012 | East | 480.00 | Output 1 (≥ 300) |
Output 1: 7 rows. Output 2: 5 rows. Both branches typically feed different sinks or different downstream transformations.
Filter & Route
Route
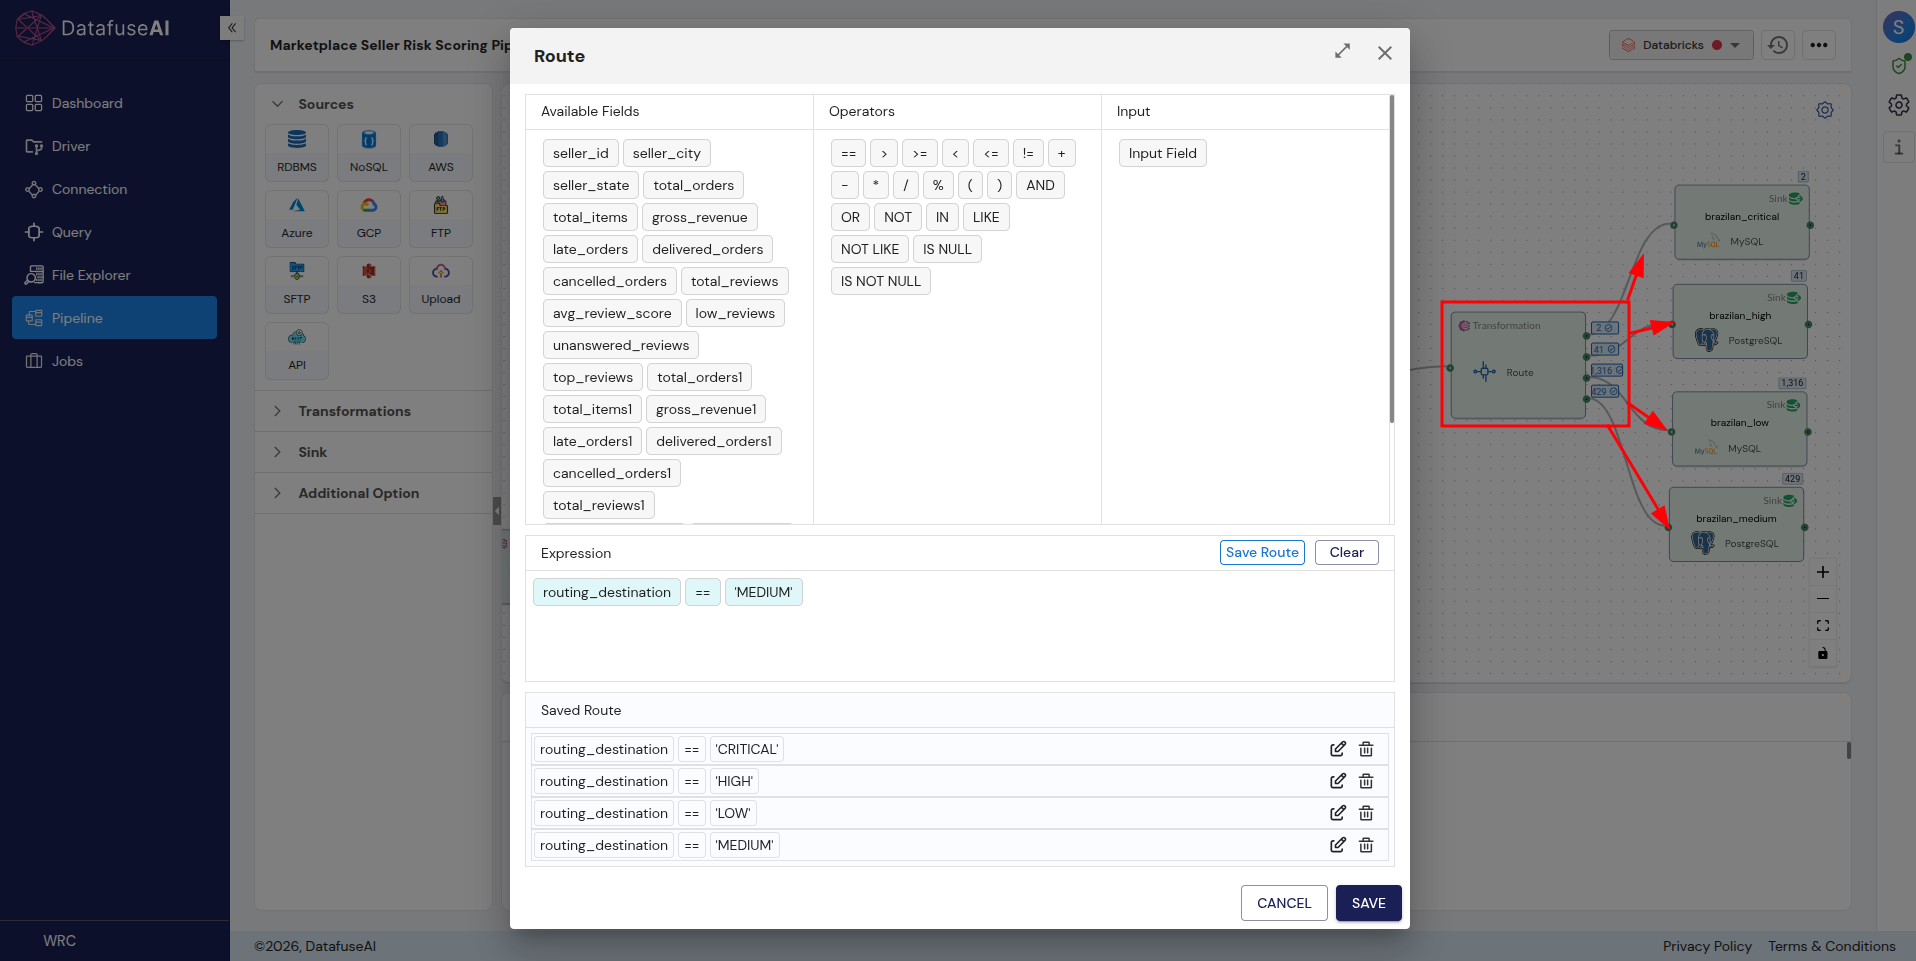
Route works like Split but supports any number of conditional branches, each defined independently, which is what you need once "yes or no" isn't enough categories.
Input — clean_orders (12 rows) · Routes: LOW (<100), MEDIUM (100–499), HIGH (500–999), CRITICAL (≥1000)
| Order ID | Amount | Route |
|---|---|---|
| O1001 | 420.00 | MEDIUM |
| O1002 | 1,180.50 | CRITICAL |
| O1003 | 95.00 | LOW |
| O1004 | 275.00 | MEDIUM |
| O1005 | 60.00 | LOW |
| O1006 | 890.00 | HIGH |
| O1007 | 340.00 | MEDIUM |
| O1008 | 610.00 | HIGH |
| O1009 | 150.00 | MEDIUM |
| O1010 | 45.00 | LOW |
| O1011 | 1,320.00 | CRITICAL |
| O1012 | 480.00 | MEDIUM |
Route summary
| Route | Order Count |
|---|---|
| LOW | 3 |
| MEDIUM | 5 |
| HIGH | 2 |
| CRITICAL | 2 |
Compute: Aggregate, Derived & Window
Compute transformations don't change which rows exist, well, Aggregate does, they calculate. The distinction between the three comes down to whether rows collapse, whether a new column gets added, and whether the calculation looks across other rows at all.
Compute
Aggregate
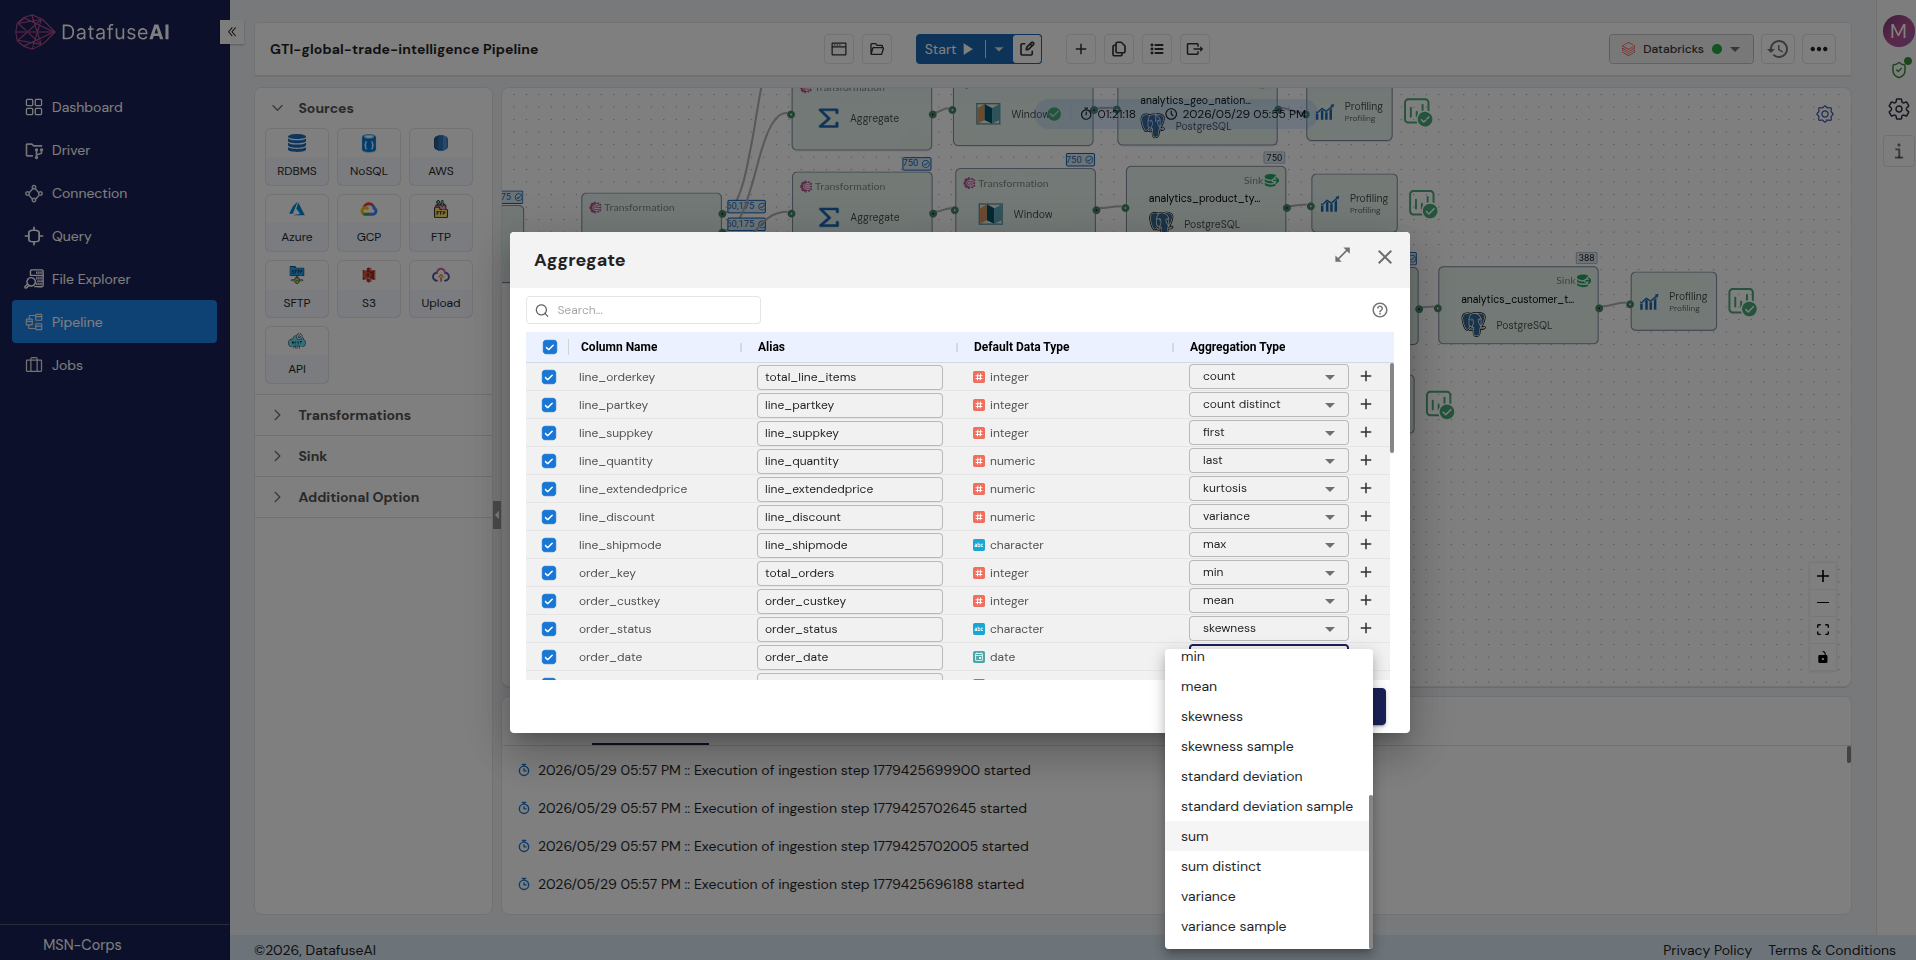
Aggregate groups rows by one or more columns and collapses each group into a single summary row.
Input — clean_orders (12 rows) · Group By: Region · Functions: sum, count, avg, max, min on Amount
Output — 4 rows
| Region | Total Revenue | Order Count | Avg Order | Max Order | Min Order |
|---|---|---|---|---|---|
| North | 1,800.00 | 3 | 600.00 | 1,320.00 | 60.00 |
| South | 2,070.50 | 2 | 1,035.25 | 1,180.50 | 890.00 |
| East | 1,525.00 | 4 | 381.25 | 610.00 | 95.00 |
| West | 470.00 | 3 | 156.67 | 275.00 | 45.00 |
Aggregation functions available (selected reference)
| Function | Description |
|---|---|
| count / count distinct | Row count, or count of unique values |
| sum / sum distinct | Total, or total of unique values only |
| avg / mean | Arithmetic average |
| min / max | Smallest or largest value in the group |
| first / last | First or last value encountered in the group |
| stddev / stddev_pop | Sample or population standard deviation |
| variance / var_pop | Sample or population variance |
| skewness / kurtosis | Distribution shape statistics |
| approx_count_distinct | Fast, approximate distinct count for large groups |
| collect_list / collect_set | All values, or all unique values, returned as an array |
Compute
Derived
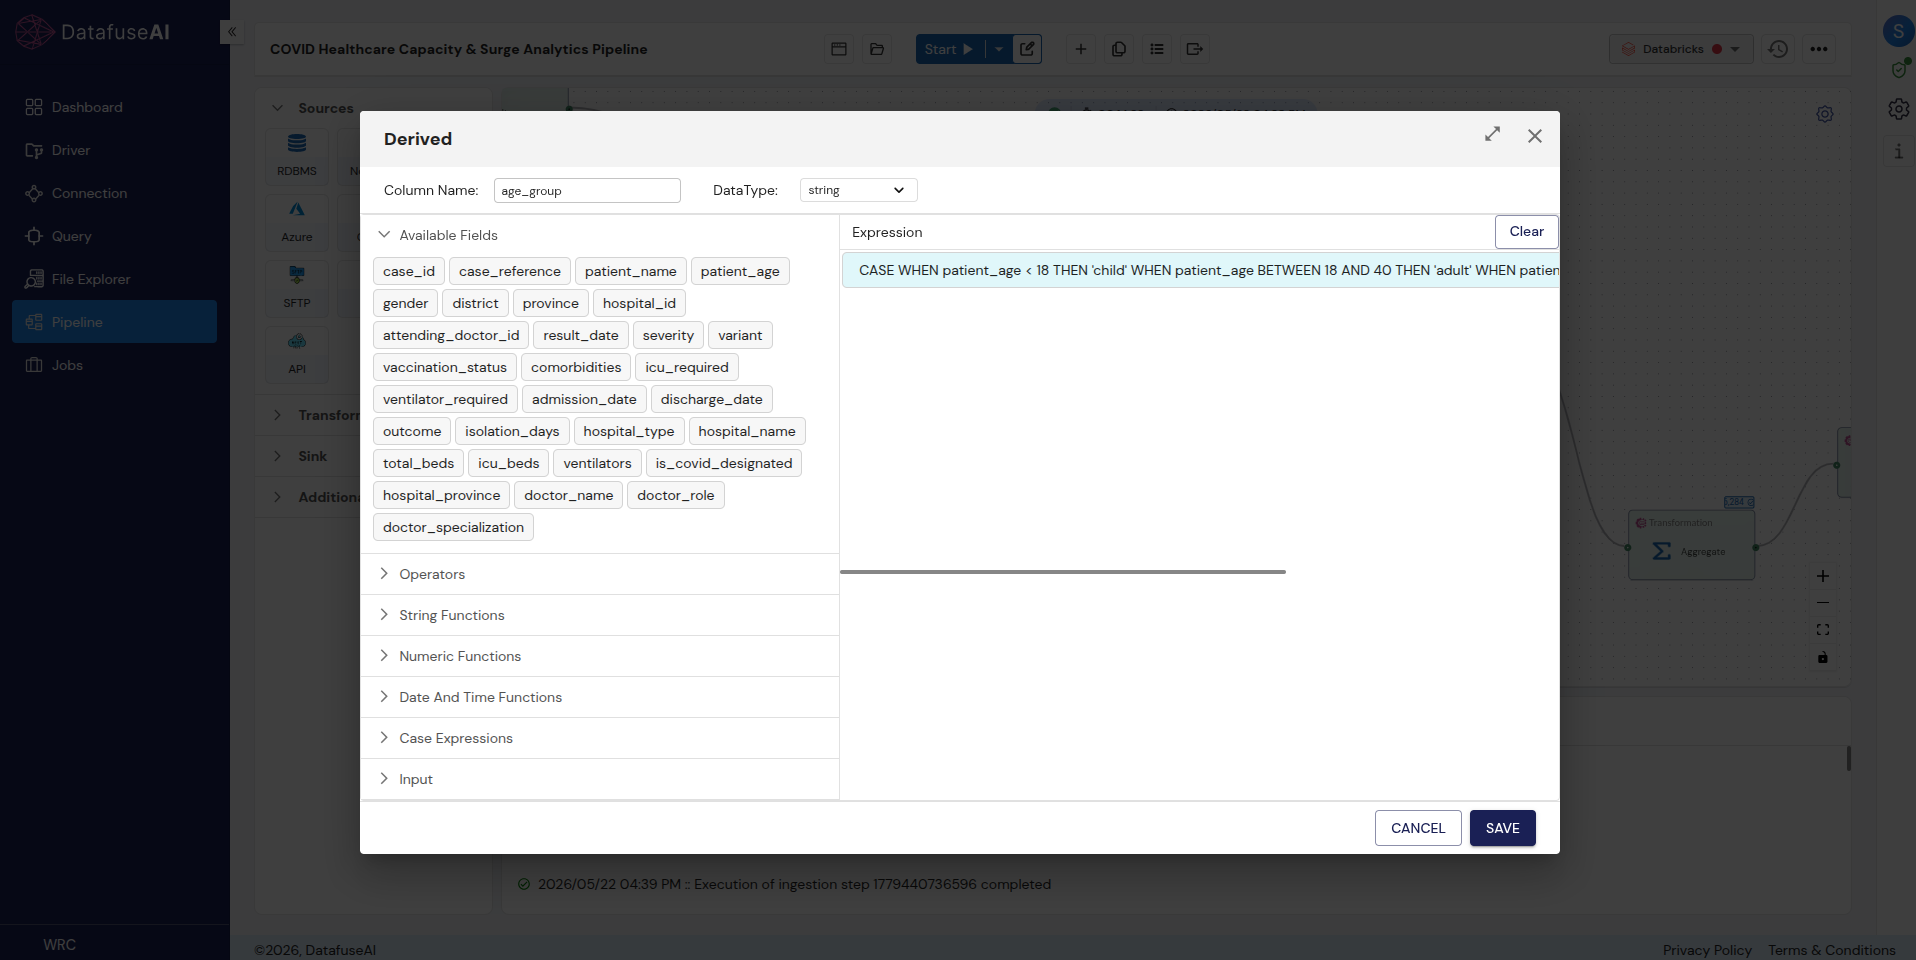
Derived adds new columns calculated from existing ones, string, numeric, date, or conditional logic, without touching row count.
Input — clean_orders (12 rows) · New columns: total_with_tax = amount × 1.08, order_year = YEAR(order_date), customer_tier = CASE WHEN amount ≥ 1000 THEN 'VIP' WHEN amount ≥ 300 THEN 'Standard' ELSE 'Occasional'
| Order ID | Amount | Total w/ Tax | Order Year | Customer Tier |
|---|---|---|---|---|
| O1001 | 420.00 | 453.60 | 2025 | Standard |
| O1002 | 1,180.50 | 1,275.06 | 2026 | VIP |
| O1003 | 95.00 | 102.60 | 2026 | Occasional |
| O1004 | 275.00 | 297.00 | 2026 | Occasional |
| O1005 | 60.00 | 64.80 | 2025 | Occasional |
| O1006 | 890.00 | 961.20 | 2026 | Standard |
| O1007 | 340.00 | 367.20 | 2026 | Standard |
| O1008 | 610.00 | 658.80 | 2026 | Standard |
| O1009 | 150.00 | 162.00 | 2026 | Occasional |
| O1010 | 45.00 | 48.60 | 2026 | Occasional |
| O1011 | 1,320.00 | 1,425.60 | 2026 | VIP |
| O1012 | 480.00 | 518.40 | 2026 | Standard |
Supported function categories (selected reference)
| Category | Example Functions | Typical Use |
|---|---|---|
| String | concat, trim, upper/lower, replace, split, substring | Cleaning and combining text fields |
| Numeric | round, abs, ceil, floor, sqrt, pow | Calculated financial or measurement fields |
| Date & Time | year, month, day, date_add, date_format, now | Extracting periods, calculating durations |
| Conditional | when / otherwise (CASE WHEN), coalesce, isNull | Tiering, flagging, and defaulting missing values |
Compute
Window
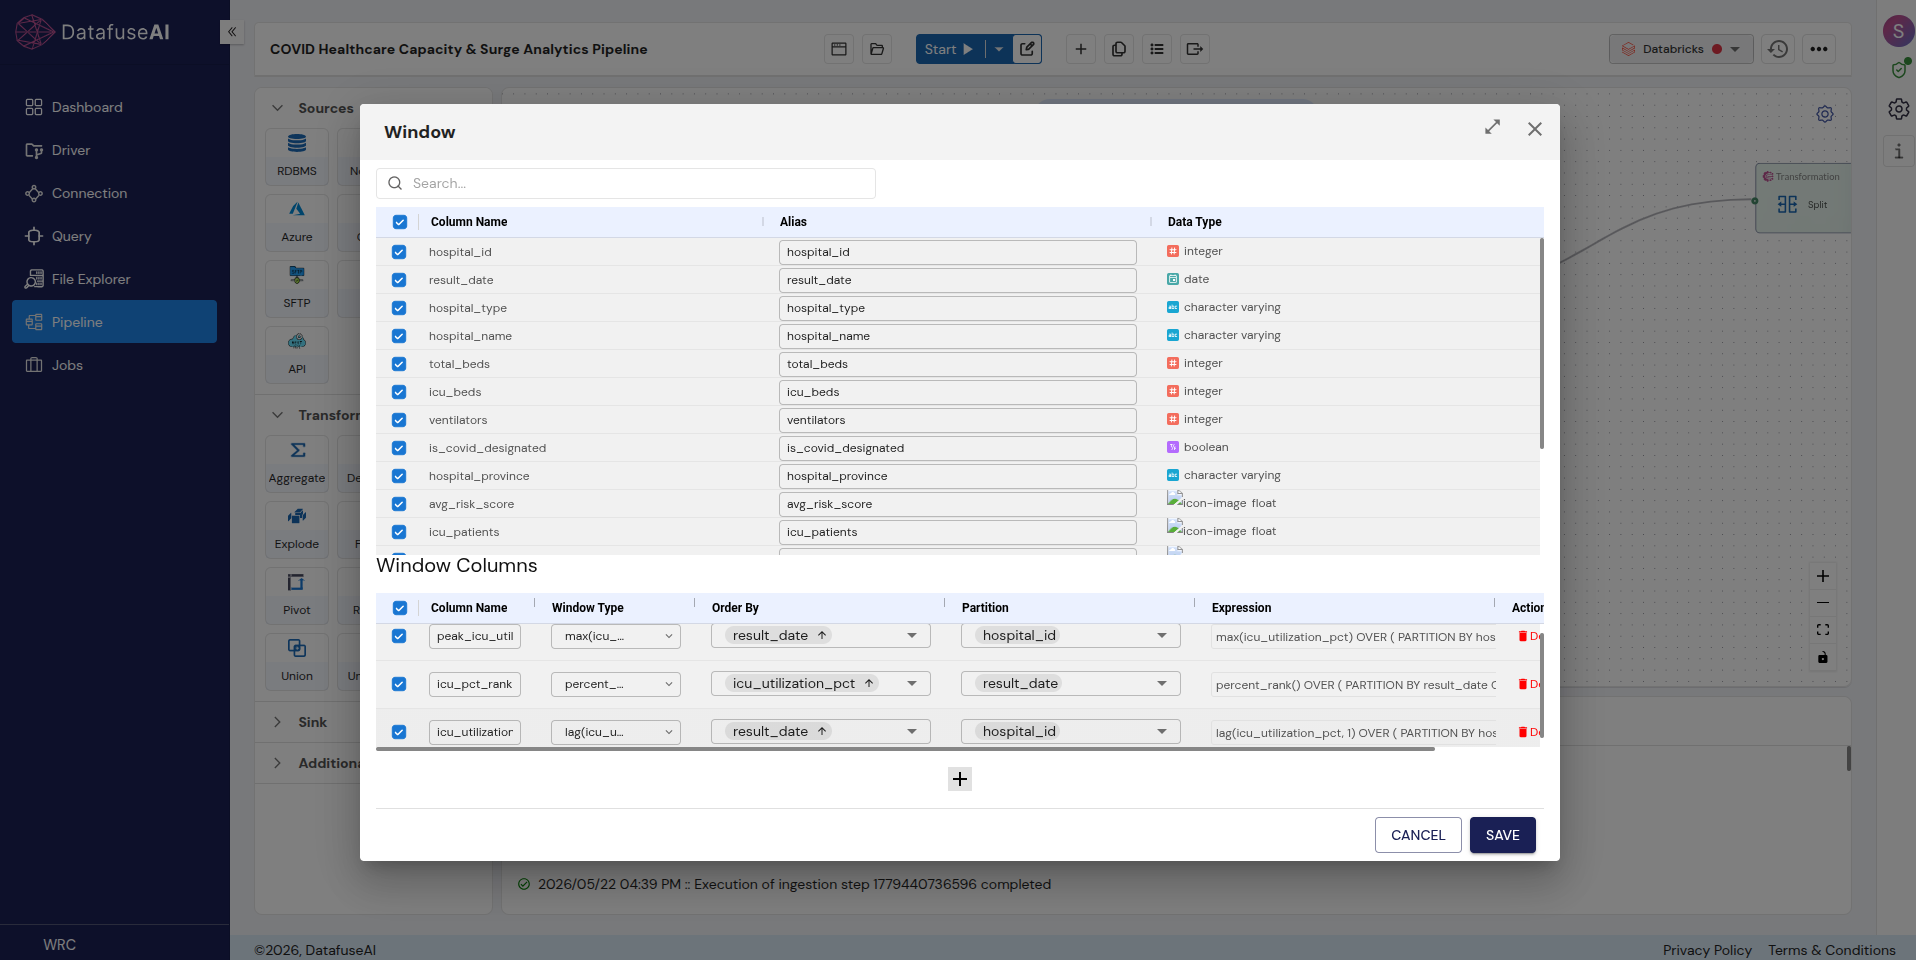
Window functions calculate across a group of related rows, a rank, a running total, a prior-row comparison, without collapsing anything. Every input row still appears in the output, just with extra columns attached.
Input — clean_orders (12 rows) · Partition By: Region · Order By: Order Date · Functions: rank() by amount desc, running total of amount
| Order ID | Region | Amount | Rank in Region | Running Total |
|---|---|---|---|---|
| O1001 | North | 420.00 | 2 | 420.00 |
| O1005 | North | 60.00 | 3 | 480.00 |
| O1011 | North | 1,320.00 | 1 | 1,800.00 |
| O1002 | South | 1,180.50 | 1 | 1,180.50 |
| O1006 | South | 890.00 | 2 | 2,070.50 |
| O1003 | East | 95.00 | 4 | 95.00 |
| O1007 | East | 340.00 | 3 | 435.00 |
| O1008 | East | 610.00 | 1 | 1,045.00 |
| O1012 | East | 480.00 | 2 | 1,525.00 |
| O1004 | West | 275.00 | 1 | 275.00 |
| O1009 | West | 150.00 | 2 | 425.00 |
| O1010 | West | 45.00 | 3 | 470.00 |
Window function types available (selected reference)
| Type | Functions | What They're For |
|---|---|---|
| Ranking | row_number, rank, dense_rank, percent_rank, ntile | Ordering rows within a partition, with or without gaps for ties |
| Analytic | lag, lead, cume_dist | Comparing a row to the one before or after it |
| Aggregate-in-window | sum, avg, min, max, count, stddev | Group-level stats attached to every row instead of collapsing them |
Quick Reference: All 12 Transformation Nodes
One table covering everything above, for whenever you already know which problem you're solving and just need the node name.
| Category | Node | What It Does | Typical Trigger |
|---|---|---|---|
| Reshape | Pivot | Rotates unique row values into columns | Long-format data needs to become wide for reporting |
| Reshape | Unpivot | Rotates columns back into rows | Wide tables need to become long for a BI tool |
| Reshape | Explode | Flattens an array field into one row per element | An API or JSON source returns list-valued fields |
| Combine | Join | Merges two sources on a matching key | Related data lives in separate tables |
| Combine | Join (Fuzzy Match) | Merges sources on an approximate text match | Keys don't match exactly across systems |
| Combine | Union | Stacks rows from sources with the same schema | Multiple systems produce the same record type |
| Filter & Route | Filter | Keeps only rows meeting a condition | Records need to be scoped by a rule |
| Filter & Route | Filter (Fuzzy Match) | Keeps rows whose text approximately matches a value | Free-text fields have inconsistent spelling |
| Filter & Route | Dedupe | Removes duplicate rows | The same record entered a pipeline more than once |
| Filter & Route | Split | Divides one stream into two branches | Two record types need different downstream handling |
| Filter & Route | Route | Divides one stream into 3+ conditional branches | Records need to go to more than two destinations |
| Compute | Aggregate | Rolls detail rows into group-level summaries | Dashboards need totals, not transaction-level detail |
| Compute | Derived | Calculates a new column from existing ones | A value should exist as a field instead of being recalculated downstream |
| Compute | Window | Computes ranks or running values without collapsing rows | Rankings, running totals, period-over-period comparisons |
Chaining Transformations Into a Real Pipeline
No single node does the whole job. A real pipeline connects several of them in sequence, and the output row count changes at every step. Here's the Union example from earlier, extended through Filter, Join, Derived, and Aggregate to land at a single regional revenue summary.
| Step | Node | Operation | Rows In | Rows Out |
|---|---|---|---|---|
| 1 | Sources | orders_store_a + orders_store_b | — | 10 + 10 |
| 2 | Union | Combine, remove exact duplicates | 20 | 18 |
| 3 | Filter | status == 'Shipped' |
18 | 11 |
| 4 | Join | Enrich with customer city & segment | 11 | 11 |
| 5 | Derived | Add tax total & customer tier | 11 | 11 |
| 6 | Aggregate | Sum revenue by region | 11 | 4 |
Each node in that chain does exactly one job: Union combines two systems into one stream, Filter scopes it down to what matters, Join adds context that wasn't in the original records, Derived calculates fields the business actually asked for, and Aggregate turns 11 transaction rows into 4 numbers a dashboard can show. That's the same design principle behind keeping change data capture pipelines incremental rather than reprocessing everything on every run.
Where Transformation Logic Breaks in Production
Every node above works correctly in a preview pane. The failures that matter show up once real, messy volume hits the pipeline.
Join keys that don't quite match
A standard Join silently drops any row whose key has a typo, trailing space, or naming variant on either side. Row counts look fine because nothing errors.
A Fuzzy Join or Fuzzy Filter step upstream reconciles near-matches to a canonical key first, so the standard Join downstream has something reliable to match against.
Union hiding near-duplicates
Union Distinct only removes rows that are identical across every selected column. A one-character difference in a customer name means the "duplicate" survives twice.
Dedupe on a narrower column set, or a Fuzzy Filter pass, catches near-duplicates that exact-match dedup logic is structurally unable to see.
Catching this kind of gap usually comes down to whether anyone is watching row counts at each step of the chain, not whether any single node was configured incorrectly. See our guide on pipeline observability for how to monitor that across a full pipeline rather than one node at a time.
Data Transformation Best Practices
| Practice | Why It Matters |
|---|---|
| Dedupe before anything else touches the data | Every downstream node inherits whatever count is wrong at the start |
| Preview every node before running the full pipeline | Catches a wrong join type or misconfigured expression before it processes real volume |
| Use Fuzzy Match only where an exact key genuinely doesn't exist | Fuzzy scoring is probabilistic; reserve it for free-text fields, not IDs |
| Keep each node doing one job | A Derived node with ten unrelated calculations is harder to debug than five focused ones |
| Name nodes descriptively on the canvas | "Filter — Shipped Orders Only" tells the next person what broke without opening the config |
None of the 12 nodes above is complicated in isolation. What makes a pipeline reliable is sequencing them correctly, deduplicate before filtering, join before aggregating, and previewing at every step so a bad assumption gets caught while it's still cheap to fix.
Frequently Asked Questions
DataFuseAI ships 12 transformation nodes across four categories: Reshape (Pivot, Unpivot, Explode), Combine (Join, Union), Filter & Route (Dedupe, Filter, Split, Route), and Compute (Aggregate, Derived, Window). Filter and Join also support a Fuzzy Match mode for approximate text matching.
Split divides one stream into exactly two branches based on a single condition: a true branch and a false branch. Route supports any number of branches, each with its own condition, which makes it the right choice once you need more than two destinations for the same stream.
A standard Join or Filter requires an exact value match. Fuzzy Match scores how similar two text values are and accepts anything above a configured threshold, which is what lets "Meridian Traders Ltd" and "Meridian Traiders Ltd" resolve to the same record instead of being treated as unrelated.
Yes. Transformation nodes connect output to input on the canvas in any order, and each node's output becomes the next node's input. A common chain is Union, then Filter, then Join, then Derived, then Aggregate, feeding a single sink at the end.
Aggregate collapses detail rows into one row per group, so row count drops. Window does the opposite: it calculates a value like a rank or running total for every row without merging any of them, so the row count going in matches the row count coming out.

 Request a Demo