
Two quotes land on the same desk. A managed service lists four marketing connectors at $511.15 a month [5]. The in-house option says $0, because the team will write the scripts. The $0 is not a price.
Data integration platform pricing has three parts: the software bill, the engineering time to build each pipeline, and the time to keep it running. At a loaded rate of $88.06 an hour, built from US median pay [1][3], each hour of upkeep a month adds about $1,057 a year. That is why the cheaper quote depends on hours more than on list prices. This guide gives the formula, published prices to plug in, a sourced labour rate and an illustrative three-year comparison you can redo with your own numbers.
Who this is for: data leads, engineering managers and finance partners pricing a new integration platform, or defending the scripts they already run. For how each vendor's meter works, see our guide to what a data integration platform is and how it's priced. For why building is mostly a staffing decision, see our build vs buy data pipeline analysis.
Key takeaways
- For US teams, $88.06 an hour is a defensible loaded rate: the 2025 median pay of database administrators and architects divided by the wage share of employer costs [1][3].
- At that rate, $1,000 a month of software equals about 11.4 engineering hours a month. Fivetran's published four-connector example, $511.15 a month, equals about 5.8 [5].
- In our illustrative example, upkeep is 73% of the hand-built option's three-year cost. The answer flips if script upkeep stays under about 4.8 hours a month.
- Measure your own upkeep hours from tickets before you trust any average, including survey figures.
Prices, wages and API schedules checked 7 November 2026.
What does a data integration platform cost?
A data integration platform costs its software bill plus the engineering time spent building pipelines and keeping them running. The software bill is a licence, subscription or usage meter, plus the infrastructure and destination compute it uses. Engineering time splits into build time, paid once per source, and upkeep time, paid every month the pipelines run.
Written as a formula, with each term something you can measure:
Annual cost = S + (B x R / Y) + (M x 12 x R)

S = software bill a year: licence or usage fee, infrastructure, destination compute
B = build hours: connect, map, test and schedule every source
Y = years you expect to keep the setup
M = upkeep hours a month: version upgrades, schema changes, failures, access reviews
R = loaded hourly rate of the people doing the work
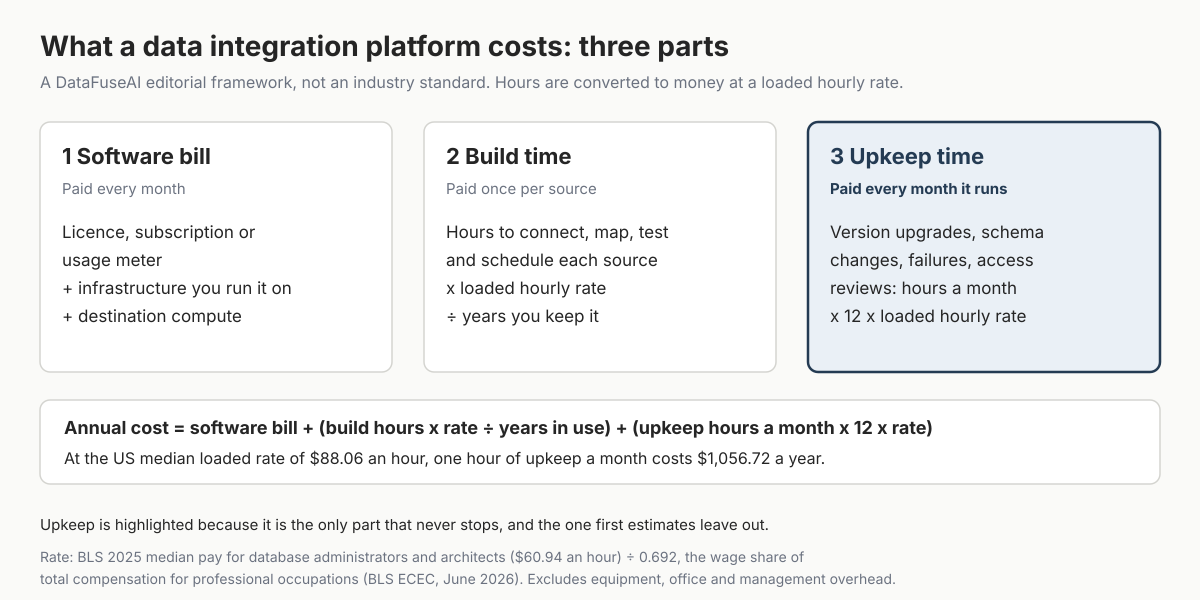
Most comparisons price S carefully and guess at B and M. The next sections put a number on each.
How do vendors price the software part?
Data integration vendors charge by rows that change, by credits for volume, by compute hours, by capacity or by a quoted licence. The meter decides what makes the bill grow, so read what each published example includes. The last column below converts each monthly figure into engineering hours at $88.06, so software and labour sit on one scale.
| Option and meter | Published example (checked 7 Nov 2026) | Per month | Equal to engineering hours a month | Left to you |
|---|---|---|---|---|
| Fivetran Standard, monthly active rows | The pricing page's median example for a company with 1 to 200 employees: Facebook Ads, Google Analytics 4, Marketo and Google Ads [5] | $511.15 | 5.8 | Destination compute; transformations are metered per model run after 5,000 free runs a month [5] |
| Airbyte Plus, credits | 100 credits for $449 a month [6]. At Airbyte's metering, that is 25 GB from databases or about 16.7 million API rows [7] | $449.00 | 5.1 | Destination compute |
| Airbyte Standard, credits | Starts at $20 a month with 5 credits, about 1 GB of syncs [6] | $20.00 | 0.2 | Destination compute, and credits beyond the five |
| AWS Glue, compute hours | AWS's example Spark job uses 6 DPUs for 15 minutes at $0.44 per DPU-hour, costing $0.66 [8]. Run daily for a year, that is $240.90. AWS announced a 30% price cut with Glue 6.0, so a 6.0 job may cost less [15] | $20.08 | 0.2 | Writing and maintaining the job code; prices vary by AWS Region and Glue version [8][15] |
| Airbyte Core, open source | Free to self-host; the page says you run and maintain it yourself [6] | $0 licence | 0 | Servers, upgrades, monitoring and every upkeep hour |
| Price on request | Common for enterprise, private-hosted and on-premise products; DataFuseAI, for one, publishes no prices | On request | Not known | Ask what support, upgrades and implementation include |
Source: vendor pricing pages and documentation as cited. The rows describe different workloads, so compare meters, not totals. Hour equivalents, the Airbyte volume and the Glue daily figure are our arithmetic, run in code.
Two details in those examples change real bills. Fivetran's example is dominated by one connector: Marketo is $424.54 of the $511.15, or 83% [5]. Fivetran also applies a $5 base charge to standard connections with 1 to 1 million monthly active rows, except on its Free plan [5]. So check your largest source's volume first, and ask whether a quote includes base charges.
Contract terms move S too. Fivetran sets annual-contract discounts by annual list price: 5% up to $37,900, rising to 22.6% and above from $145,340 [5]. For each vendor's meter in more depth, and the pricing basis of 12 enterprise vendors, see our enterprise data integration platform comparison.
The software bill also grows after year one. On usage meters, more rows or gigabytes mean a bigger bill; on Fivetran, each extra connection under 1 million monthly active rows also carries the $5 base charge [5]. On Airbyte, the same growth can change the cheapest plan: its FAQ says Plus is typically cheaper than Standard from 40 credits a month [6]. Implementation or onboarding services, where a vendor sells them, are a separate line to ask about. Price year three at the volume you expect then, not at today's.
What is an hour of engineering time worth?
For US teams, a defensible starting rate is $88.06 an hour. That is the 2025 median pay of database administrators and architects, $60.94 an hour [1], divided by 0.692. In June 2026, wages and salaries were 69.2% of employer costs for professional occupations in private industry; benefits were the other 30.8% [3].
BLS has no occupation called data engineer, so we use the closest published group and show two neighbours for comparison:
| BLS occupation | Median pay (May 2025) | Loaded cost a year (pay / 0.692) | Loaded cost an hour | One upkeep hour a month, per year |
|---|---|---|---|---|
| Database administrators and architects | $126,760 a year, $60.94 an hour [1] | $183,179 | $88.06 | $1,056.72 |
| Database architects | $139,500 a year [1] | $201,590 | $96.92 | $1,163.04 |
| Software developers | $135,980 a year [2] | $196,503 | $94.47 | $1,133.64 |
Source: BLS Occupational Outlook Handbook [1][2] and Employer Costs for Employee Compensation, Table 4 [3]. The first row starts from BLS's published hourly median; the other rows divide annual cost by 2,080 hours, the work year BLS uses to convert hourly and annual wages [4]. Loaded figures are our arithmetic.
Three limits apply. These are national medians, so local pay and senior engineers cost more or less. The 0.692 share is an average for all professional occupations, not computer jobs alone [3]. And the rate leaves out equipment, software seats, office space, management time and hiring, so treat it as a floor.
Outside the US, replace R with your own payroll cost per hour, including employer taxes and benefits. The formula doesn't change.
Where does upkeep time go?
Upkeep time is the hours spent keeping existing pipelines correct. It covers upgrades to new API versions, schema changes, failed runs, credential rotation, access reviews and, if you host the platform, patching it. None of that work adds a new source, which is why first estimates tend to skip it.
Some of it arrives on a vendor's calendar. Google released four major Google Ads API versions in 2026: v23 on 28 January, v24 on 22 April, v25 on 22 July and v26 on 14 October [10]. Its documentation says major versions have "a lifespan of around 12 months", and sunset versions stop working [10]. A hand-built Google Ads extract therefore needs at least one version upgrade a year just to keep running.
Survey data suggests the total is large at big companies, with caveats. Fivetran's 2026 benchmark reports that 53% of engineering capacity goes to maintaining and troubleshooting pipelines. It also reports 4.7 pipeline failures a month, each taking nearly 13 hours to resolve [9]. Fivetran sells managed pipelines and published the survey itself. Its 500 respondents were senior leaders at enterprises with more than 5,000 employees, surveyed in Q4 2025 [9]. Treat it as a signal, not as your team's rate.
| Upkeep task | What drives the hours | Ask of every option |
|---|---|---|
| API version upgrades | How many sources are SaaS APIs, and how often they retire versions | Who updates the connector, and how much notice do we get? |
| Source schema changes | New, renamed or retyped fields in source systems | Is a change applied, blocked or flagged, and who fixes downstream models? |
| Failed runs and reruns | Source outages, expired credentials, timeouts | Does a rerun duplicate rows, and who is alerted? |
| Platform patching and upgrades | Self-hosted software and its servers | Who patches, and how long does an upgrade take? |
| Access reviews and credentials | Number of systems, rotation policy, audit needs | Can we see who changed what, and when? |
| Small change requests | New fields, filters and destinations asked for by users | Is this a configuration change or new code? |
Source: DataFuseAI editorial checklist. Google Ads cadence from Google's documentation [10].
To measure your own M, pull the last 90 days of pipeline tickets, alerts and on-call notes, add up the hours by task type and divide by three. If nobody tracks this, ask the engineers who run the pipelines to log upkeep for four weeks.
Worked example: build or buy four marketing connectors
Running the formula on the four connectors in Fivetran's own pricing example shows how much the upkeep assumption matters. The software price is published rather than invented [5], and the example is illustrative. The hours are our assumptions, and the rate is the BLS-based $88.06 [1][3]. On these inputs, hand-built scripts cost $52,132 over three years and the managed service $29,321.
| Input | Hand-built scripts | Managed service | Basis |
|---|---|---|---|
| Software bill | $0; runs on a scheduler the team already has | $511.15 a month, held flat | Fivetran's median example [5] |
| Build or setup | 40 hours per source, 160 in total | 4 hours per source, 16 in total | Illustrative assumption |
| Upkeep | 12 hours a month | 3 hours a month | Illustrative assumption |
| Rate and horizon | $88.06 an hour, three years | $88.06 an hour, three years | BLS [1][3]; illustrative horizon |
Source: inputs as listed; hours are illustrative assumptions, not measurements.
| Three-year cost (illustrative) | Hand-built scripts | Managed service |
|---|---|---|
| Software bill | $0.00 | $18,401.40 |
| Build or setup time | $14,089.60 | $1,408.96 |
| Upkeep time | $38,041.92 | $9,510.48 |
| Total | $52,131.52 | $29,320.84 |
Source: our calculation in code from the inputs above.
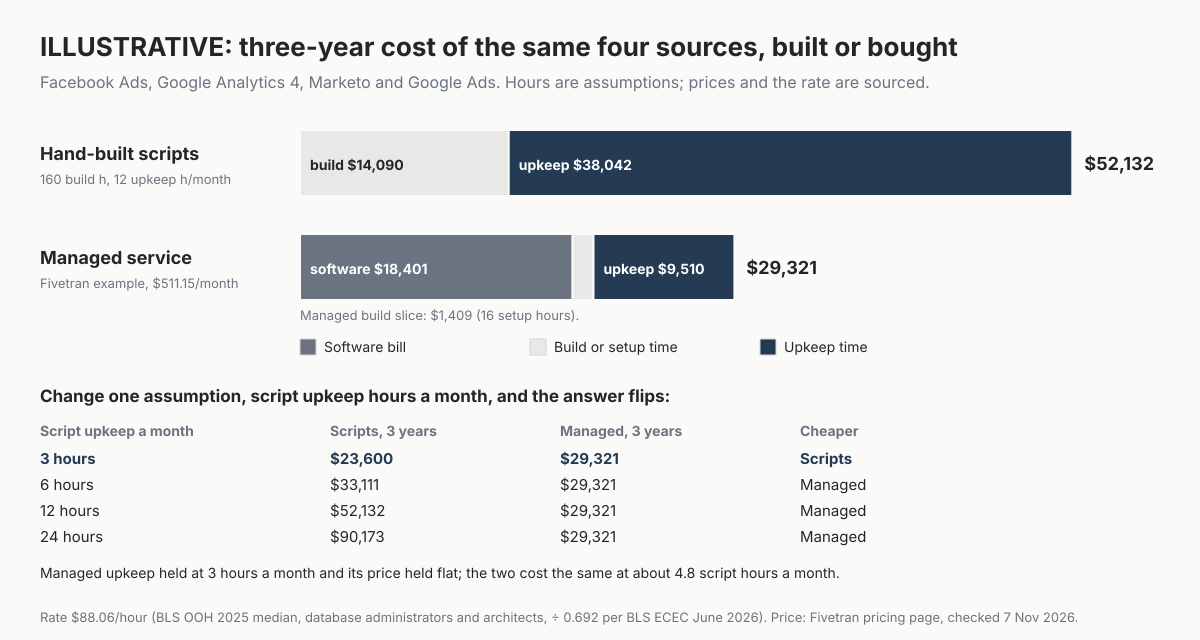
Upkeep is 73% of the hand-built option's three-year cost, and the software bill is 63% of the managed option's. So the comparison turns on one number: script upkeep hours. With managed upkeep held at 3 hours a month, the two options cost the same at about 4.8 script hours a month. At 3 hours, scripts win by $5,721. At 6 hours, the managed service wins by $3,790.
Changing the other inputs moves the totals less. At the software developer rate of $94.47, the totals become $55,926 and $30,116. Fivetran's 5% discount band would bring the managed total to $28,401. That band's "what you pay" column starts at $12,000 a year, against this example's $6,134, so ask whether an annual contract is offered at this size [5].
The example leaves out Fivetran's $5 base charge per connection if the median prices don't already include it, which could add $720 over three years [5]. It also leaves out destination compute, transformation runs, monitoring tools, the cost of a failure that reaches a report, price changes at renewal and the cost of leaving. Our post on vendor lock-in in data infrastructure covers how to estimate the exit cost before you sign.
How to price your own setup in a week
A team can price its own data integration setup in about a week by replacing each assumption in the formula with measured numbers. Most of the work is collecting the build and upkeep hours your team already spends but rarely records, then getting quotes on real volumes.
- List sources and destinations with monthly volumes: rows changed for APIs, gigabytes for databases and files.
- Measure upkeep (M) from 90 days of tickets, alerts and on-call notes, or a four-week log.
- Time one real onboarding (B) from credentials to a scheduled, tested pipeline, for each option you're considering.
- Get quotes on your volumes on the same contract term. Ask about base charges, overage rates, annual discounts and renewal terms.
- Run the formula over three years with your loaded rate, then again with M doubled. If the answer flips, M is what to verify.
- Add the exit cost: the rebuild effort for each pipeline if you leave.
- Test the closest two options on one recurring workflow, recording setup and upkeep hours. Our ETL proof of concept framework sets out the phases.
For self-hosted open source, add server and storage costs to S and patching hours to M.
Mistakes to avoid
- Pricing scripts at $0. Build and upkeep hours are the bill, and they continue after launch.
- Using salary instead of loaded cost. Salary leaves out about 31% of what employers pay for professional staff [3].
- Comparing list prices on different meters. Convert rows, credits and compute hours to the same monthly volume before you compare.
- Treating survey averages as your rate. Vendor surveys of large enterprises describe their respondents, not your team [9]; measure your own.
- Ignoring the largest connector. In Fivetran's example, Marketo alone outweighs the other three sources combined [5].
- Forgetting where the platform runs. Our guide to managed cloud, private-hosted and on-premise ETL explains who carries infrastructure and operations in each model.
Where DataFuseAI fits (and where it doesn't)
DataFuseAI, the publisher of this guide, publishes no prices, so it can't go in the comparison table without a quote. What its product pages do say decides which part of the formula each cost lands in: the software bill, build time or upkeep time.
Fits:
- Teams that want platform upkeep out of M. For managed deployments, DataFuseAI says it hosts and operates the platform, including application servers, upgrades and patches [12].
- Teams that must keep infrastructure in-house. The on-premise option "puts the infrastructure in your hands", so server costs go in S and patching in M [12].
- Scheduled batch and hybrid pipelines from the sources on its connectors page, which advertises "50+ native integrations" across databases, cloud services, files, FTP, SFTP and S3, plus REST APIs [13][14].
May not fit:
- Streaming sources. DataFuseAI states that it does not support sources such as Kafka, Kinesis or Pub/Sub [14].
- SaaS marketing sources like the four in the worked example. DataFuseAI lists no pre-built connectors for them; they would go through its generic REST API connector [13]. Time the authentication and paging set-up for each one before you price it.
- Private-hosted buyers who need the operating split in writing. DataFuseAI's pages describe private-hosted operations inconsistently, so ask who patches and upgrades before you fill in M.
DataFuseAI's free 30-day POC covers one recurring workflow with two or three data sources, with no POC fee and no obligation. Applications are reviewed, and any external cloud or compute costs stay with you [11]. Record setup and upkeep hours during the test to fill in B and M.
Frequently Asked Questions
Is open source data integration cheaper than a paid platform?
The licence is cheaper; the total may not be. Airbyte Core, for example, is free to self-host, but its own pricing page says you run and maintain it yourself [6]. That moves servers into the software bill and patching, upgrades and connector fixes into upkeep hours. Our analysis of open source ETL against a commercial platform covers the costs that arrive after year one.
How much should we budget per data source?
There is no honest single figure, because meters and upkeep vary by source. Even within Fivetran's own example, median monthly list prices range from $15.88 for Google Analytics 4 to $424.54 for Marketo [5]. Price each source on its own volume, add build and upkeep hours at your loaded rate, and budget per pipeline rather than per connector count.
Should warehouse compute count as an integration cost?
Yes, when your pipelines transform data inside the warehouse. In that pattern the transformation runs on the warehouse's meter, not the integration vendor's, so it belongs in the software bill. Fivetran, for instance, prices its transformations separately by model run [5]. Leaving warehouse compute out makes ELT-style tools look cheaper than they are.
How often should we recalculate the cost?
Recalculate at each contract renewal, whenever you add several sources, and when upkeep hours change noticeably. Prices change at renewal, and API schedules such as Google Ads' yearly sunsets add work on a fixed calendar [10]. A quarterly look at upkeep tickets is usually enough to catch drift before it turns into a surprise.
Methodology
What we read. We read the pricing pages of Fivetran, Airbyte and AWS Glue, AWS's Glue 6.0 announcement, Airbyte's credit documentation and Google's Ads API deprecation schedule. We also read the BLS Occupational Outlook Handbook, the June 2026 Employer Costs for Employee Compensation release and the May 2025 OEWS technical notes. Fivetran's 2026 benchmark release and DataFuseAI's own pages complete the list. All were read on 7 November 2026 between about 08:38 and 08:48 UTC.
The labour rate. We divided BLS median pay for database administrators and architects by 0.692, the wage share of total compensation for private-industry professional occupations in June 2026. Hourly figures use 2,080 hours a year. The rate excludes overhead.
The worked example uses the four connectors and the $511.15 total from Fivetran's published Standard plan example, held flat for three years. Build and upkeep hours are our illustrative assumptions, not measurements of any team or product. All arithmetic, including hour equivalents and sensitivity checks, was run in a Python script, cost_model.py.
Survey data from Fivetran's benchmark is quoted as published, not converted to costs, because it covers large enterprises and self-reported estimates.
References
- U.S. Bureau of Labor Statistics, Occupational Outlook Handbook, "Database Administrators and Architects: Pay", May 2025 data, last modified 27 Aug 2026. https://www.bls.gov/ooh/computer-and-information-technology/database-administrators.htm
- U.S. Bureau of Labor Statistics, Occupational Outlook Handbook, "Software Developers, Quality Assurance Analysts, and Testers: Pay", May 2025 data, last modified 27 Aug 2026. https://www.bls.gov/ooh/computer-and-information-technology/software-developers.htm
- U.S. Bureau of Labor Statistics, "Employer Costs for Employee Compensation, Table 4: Private industry workers by occupational and industry group", June 2026, released 9 Sep 2026. https://www.bls.gov/news.release/ecec.t04.htm
- U.S. Bureau of Labor Statistics, "Technical Notes for May 2025 OEWS Estimates", read 7 Nov 2026. https://www.bls.gov/oes/2025/may/oes_tec.htm
- Fivetran, "Pricing" page, read 7 Nov 2026. Vendor page. https://www.fivetran.com/pricing
- Airbyte, "Pricing" page, read 7 Nov 2026. Vendor page. https://airbyte.com/pricing
- Airbyte documentation, "Manage billing and credits", read 7 Nov 2026. https://docs.airbyte.com/platform/cloud/managing-airbyte-cloud/manage-credits
- Amazon Web Services, "AWS Glue pricing", read 7 Nov 2026. https://aws.amazon.com/glue/pricing/
- Fivetran, "Data Pipeline Failures Cost Enterprises $3 Million per Month, Fivetran Benchmark Finds", press release, 26 Mar 2026. Vendor-published survey. https://www.fivetran.com/press/data-pipeline-failures-cost-enterprises-3-million-per-month-fivetran-benchmark-finds
- Google for Developers, Google Ads API, "Deprecation and sunset", last updated 30 Oct 2026. https://developers.google.com/google-ads/api/docs/sunset-dates
- DataFuseAI, "Free 30-Day Data Integration POC" page, read 7 Nov 2026. https://www.datafuseai.com/free-poc
- DataFuseAI, "Deployment Options" product page, read 7 Nov 2026. https://www.datafuseai.com/platform/deployment-options
- DataFuseAI, "Data Connectors" product page, read 7 Nov 2026. https://www.datafuseai.com/platform/data-connectors
- DataFuseAI, "Batch vs CDC vs Streaming: A Leadership Decision Framework", 24 Aug 2026. https://www.datafuseai.com/blogs/batch-vs-cdc-vs-streaming
- Amazon Web Services, "AWS Glue 6.0 delivers 30% price reduction and Iceberg v3 support", What's New, 21 Aug 2026. https://aws.amazon.com/about-aws/whats-new/2026/08/aws-glue-6-0-price-reduction-iceberg-v3/
 Request a Demo