
Finance asks for revenue by customer segment and support load in one table. Segments live in the CRM, invoices in billing and tickets in the help desk. Someone exports three CSVs, pastes them into a spreadsheet, and the total comes out more than three times too high.
To combine data from multiple sources, you either append rows that share a structure or join columns on a shared key, which Power Query calls a merge [1]. Without custom pipelines, that work runs in a tool that already connects and schedules: a spreadsheet, a BI tool, a database that queries other databases, a replication service, or a data integration platform. This guide compares the five options by their documented limits, then gives five checks that catch a bad join before anyone reads the number.
Who this is for: analysts, operations leads and data engineers who need a recurring combined report and don't want to write and maintain extraction code. If the numbers already disagree between systems, start with our guide to why systems disagree.
Key takeaways
- Decide append or join first. Append stacks sources with the same columns; join links different tables on a key.
- Pick the method by where the join should run. Spreadsheets and BI tools join at report time; federation queries the source; replication copies data into a warehouse first.
- Each method has a documented ceiling. Looker Studio, now Data Studio, blends up to five tables [2]. A BigQuery federated query can use at most 10 connections and is read-only [3].
- Run five checks on every join: key, grain, row count, orphans and totals. In our illustrative example, a row-level join reported $109,200 of revenue against a correct $34,200.
Product documentation checked 5 November 2026; three Microsoft pages checked 6 November 2026.
Append or join: which do you need?
Appending stacks two tables with the same columns, such as two months of invoices or two ad accounts. Joining puts columns from different tables side by side, matched on a key such as a customer ID. Most cross-system reports need a join, and joins are where totals go wrong.
Power Query, the data tool in Excel and Power BI, calls a join a merge. It describes a merge as joining two tables "based on matching values from one or multiple columns" and offers six join kinds: left outer, right outer, full outer, inner, left anti and right anti [1]. Anti joins return only rows with no match, which makes them the quickest way to find orphans.
Two rules from the same documentation cause most first-time errors. Matching columns must be the same data type, and when you join on several columns, you must select them in the same order in both tables [1]. Microsoft's pages also disagree on the default join kind: the Excel help page says inner [13], while the Power Query M reference says Table.NestedJoin performs a left outer join when no kind is given [15]. Choose the join kind explicitly, and check the match count Power Query shows for a top set of rows before you click OK [13].
What are the ways to combine data without custom pipelines?
The five methods differ by where the join runs and how fresh the result is. A spreadsheet or BI tool joins at report time, and federation sends queries to the live source. Replication copies data, continuously or on a schedule depending on the tool, so the join runs in a warehouse. An integration platform runs the join as a scheduled, checked pipeline.
| Method | Where the join runs | Documented limit | Fits when |
|---|---|---|---|
| Spreadsheet or Power BI with Power Query | In the workbook or model | Matching columns must share a data type; fuzzy matching works on text columns only [1] | One analyst, a few sources, monthly refresh |
| BI tool blend (Looker Studio, now Data Studio) | In one report | Up to five tables; equality joins only; a blend can't be reused across reports [2] | A chart that needs two or three sources |
Federated query (BigQuery EXTERNAL_QUERY, PostgreSQL postgres_fdw) |
In the database you query from | BigQuery: read-only, at most 10 connections, likely slower than querying BigQuery storage [3]. PostgreSQL: foreign table columns should generally match remote types and collations [4] | Occasional queries against live operational data |
| Replication into a warehouse (AWS zero-ETL, managed ELT tools) | In the warehouse, after data lands | AWS zero-ETL into Amazon Redshift works only from listed sources [5] | Many reports reuse the same joined tables |
| Data integration platform | In a scheduled pipeline with validation steps | Not documented in one place; varies by vendor and plan | Recurring reports that need checks, history and an owner |
Source: each product's own documentation, read 5 November 2026, as cited. The "Fits when" column is DataFuseAI's editorial judgement.
1. Spreadsheets and Power Query
Power Query is the lowest-effort option for a recurring report owned by one person. It merges tables on one or more columns and offers anti joins for finding unmatched rows [1]. Power Query in Excel adds privacy levels, which are designed to stop you combining data from private or organisational sources by accident [13].
Power Query becomes the wrong tool when the report needs a second owner, a schedule nobody has to remember, or a record of what each refresh contained.
2. Blends in a BI tool
A blend joins data inside a dashboard without writing SQL. Google's documentation for Data Studio, formerly Looker Studio, lists inner, left outer, right outer, full outer and cross joins [2]. Join conditions must use equality, so "date within 7 days" or "amount greater than" can't be a join condition [2].
Blends also have no freshness or credential settings of their own; they inherit them from each data source [2]. Two sources that refresh at different times can produce a blended chart that matches neither system.
3. Federated queries: join without copying
Federation leaves data where it is and queries it from another database. BigQuery's EXTERNAL_QUERY sends SQL to Spanner, Cloud SQL, AlloyDB or SAP Datasphere (in preview) and returns the result as a temporary table that you can join with BigQuery tables [3]. PostgreSQL's postgres_fdw maps remote tables as foreign tables, and usually sends a join between tables on the same foreign server to that server [4].
The documented trade-offs are load and speed. Google says a federated query "is likely to not be as fast" as querying BigQuery storage, and recommends querying a read replica to protect the source [3]. A BigQuery single region can only query a source in the same region [3].
4. Replication into a warehouse, then SQL
Replication copies each source into one warehouse, continuously or on a schedule depending on the tool, and you join with SQL or a visual tool there. AWS zero-ETL integrations make data available in Amazon Redshift from listed sources, including Aurora, RDS, DynamoDB, Salesforce, SAP, ServiceNow and Zendesk [5]. Managed ELT tools offer the same pattern for other warehouses; our no-code platform comparison covers the managed tools.
Replication moves the data, not the meaning. Our zero-ETL limitations post argues that transformation, schema management and governance still have to happen after the copy [9].
5. A data integration platform
A data integration platform connects, transforms, joins, validates and schedules in one place, so the combined table is rebuilt the same way each run. Our guide to data integration platforms covers the layers a platform should include.
In our own HubSpot API walkthrough, the pipeline unioned companies and contacts instead of joining them, because the associations were too constrained to join reliably. It left-joined deals to owners on hubspot_owner_id, a key that was populated [6]. Choosing union or join per pair of tables, from what the keys actually contain, is the decision the five checks below support.
How do you know a join is correct? The five-check test
A join can run without errors and still be wrong. Five checks catch most of it: the key, the grain, the row count, the orphans on each side, and the totals against the source. Each takes one query or one anti join, and each can be repeated on every refresh.
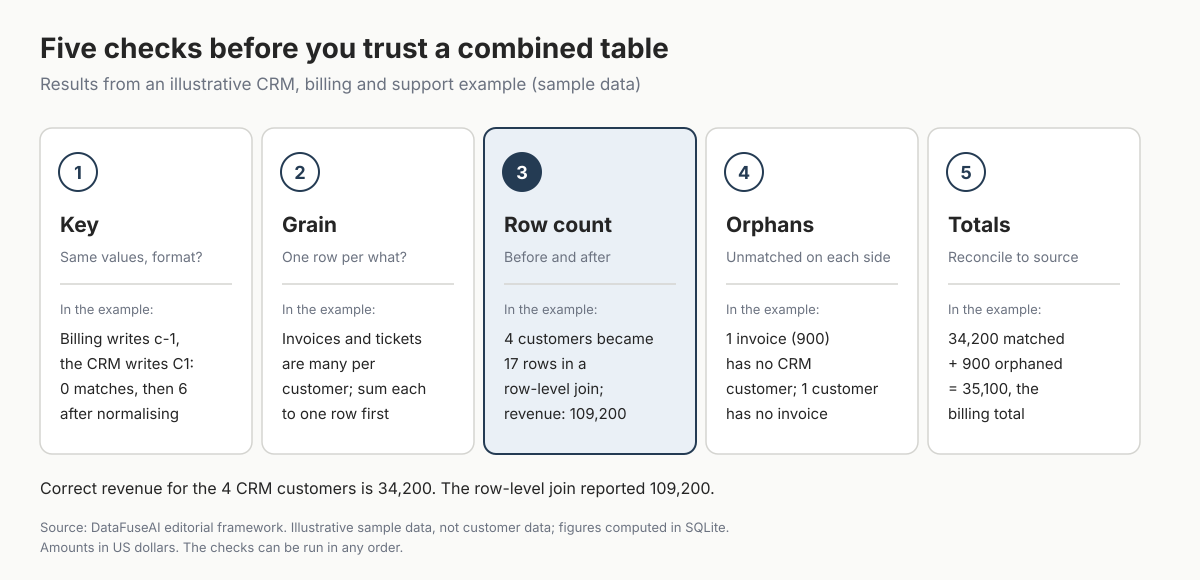
- Key: do both sides hold the same values in the same format? Count matches before you trust the join. Power Query warns that columns of different data types may not give correct results [1].
- Grain: one row per what? Write down what one row means in each table: a customer, an invoice, a ticket. Join only at a shared grain, so sum invoices and tickets to one row per customer first.
- Row count: before and after. A left join keeps the left table's row count only when the key is unique on the right side. If the count rises, a key repeated on the right side has multiplied rows.
- Orphans: what didn't match on either side? Run a left anti and a right anti join, the kinds Power Query offers for this [1]. Unmatched rows are either data errors or a missing source.
- Totals: does the combined table reconcile? Sum a key measure and compare it with the source system. Our post on conflicting numbers recommends comparing output counts with earlier runs before results reach users [7].
Worked example: how a row-level join inflated revenue
Four CRM customers, seven invoices and seven support tickets make up the invented sample data in this illustrative example. It shows each of the five checks failing in turn, then the fix that makes revenue reconcile with the billing system. The SQL ran in SQLite.
| Step | What happened | Result |
|---|---|---|
| Key | Billing stores c-1; the CRM stores C1 |
0 matches; 6 of 7 invoices match after converting to upper case and removing the dash |
| Grain and row count | CRM joined to invoices and tickets at row level | 4 customers became 17 rows; customer C1's 3 invoices × 4 tickets gave 12 rows |
| The wrong total | Revenue summed over the 17 rows | $109,200 reported |
| Orphans | Left anti and right anti checks | 1 invoice ($900) for a customer missing from the CRM; 1 customer with no invoice |
| The fix | Sum invoices and count tickets per customer, then join one row per customer | 4 rows; $34,200 for the four CRM customers |
| Totals | $34,200 matched plus $900 orphaned | $35,100, equal to the billing system's total |
Source: illustrative sample data computed in SQLite on 5 November 2026; amounts in US dollars. Not customer data.
The wrong total came from no single bug. Each join was valid SQL; together they multiplied every invoice by the number of tickets for the same customer. The fix is to aggregate each source to the shared grain before joining.
When is a custom pipeline still the right call?
Custom code earns its keep when no tool can reach the source, when the logic can't be expressed in a tool's join and transform steps, or when the volume or latency is beyond what the tool supports. Our build vs buy analysis argues that the deciding number is the annual cost to maintain the build at future scale [14].
For a one-off pull by someone who writes Python, a script is often the better tool, and our API walkthrough says so [6]. The calculation changes when the same pull needs authentication refresh, pagination, typing, a schedule and checks every month.
Mistakes to avoid
- Joining before aggregating. Two one-to-many tables joined on the same key multiply each other's rows.
- Trusting the default join kind. Microsoft's own pages disagree on it, so set it explicitly [13] [15].
- Joining on display names. Names change and repeat; join on IDs, and keep name matching for a fuzzy step with a threshold you chose [8].
- Checking only the rows that matched. An inner join hides what didn't match; run a left anti and a right anti join as well [1].
- Pointing federation at the primary database. Google recommends a read replica for workload isolation [3].
Where DataFuseAI fits (and where it doesn't)
DataFuseAI, the publisher of this guide, builds scheduled pipelines on a visual canvas. Its published API walkthrough builds the pipeline from Join, Union, Aggregate and Profiling steps, then compares the landed sums and counts with values known from the source [6]. That is check 5 in this guide. The same Join step offers a Left-Anti kind, which is what check 4 needs [6].
Fits:
- Recurring combined reports from databases, cloud database services, files, FTP and SFTP, S3 and REST APIs [10] [11].
- Joins on messy names, using fuzzy join with a 0–100 similarity score and a threshold per column pair in Individual Score mode [8].
- Teams that need cloud, private-hosted or on-premise deployment [11].
May not fit:
- Sources that need a pre-built SaaS app connector: the connectors page lists none, only a generic REST API connector [10].
- Streaming sources: DataFuseAI does not support Kafka, Kinesis or Pub/Sub [12].
- A chart that needs two sources once: a Power Query merge or a BI blend is less work.
DataFuseAI's data integration platform has a free trial that starts with connecting your first source, with no credit card [11].
Frequently Asked Questions
What is the difference between data blending and data integration?
Blending joins sources for one chart or report at the moment it is viewed. Google's documentation says a blend is embedded in the report where it was created and can't be reused across reports [2]. Integration builds a combined dataset that many reports reuse, on a schedule, with its own checks. Use blending to explore and integration once the number matters to more than one team.
Can I join data from two different databases without copying it?
Yes, with federation. BigQuery's EXTERNAL_QUERY sends a query to Spanner, Cloud SQL, AlloyDB or SAP Datasphere (in preview) and returns the result as a temporary table that you can join with BigQuery tables [3]. PostgreSQL's postgres_fdw reads remote PostgreSQL tables as foreign tables [4]. Google says federated queries are likely slower than querying BigQuery storage [3].
How do I join tables when the keys don't match exactly?
First try to normalise the key: trim spaces, fix case and remove separators, as in the worked example. If the values truly differ, such as two spellings of a company name, use fuzzy matching. Power Query supports fuzzy merges on text columns only [1]. Our fuzzy matching guide explains how to choose a threshold [8].
Can I combine data in Excel without Power Query?
Yes, for small jobs in Microsoft 365 or Excel 2021 and later; XLOOKUP isn't available in Excel 2016 or 2019 [16]. It pulls a value from another table by key and, unless you set if_not_found, returns #N/A when there's no match [16]. It returns only the first match it finds, so sum repeated keys first or use a Power Query merge [1] [16].
Methodology
What we read. We read product documentation from Microsoft (Power Query and Excel), Google (Data Studio blends and BigQuery federated queries), the PostgreSQL project (postgres_fdw) and AWS (zero-ETL integrations). We also read DataFuseAI's own published posts and product pages. All of it was read on 5 November 2026 between about 17:25 and 17:30 UTC. We re-checked the Excel merge page and read the Power Query M Table.NestedJoin reference and the Excel XLOOKUP help page on the morning of 6 November 2026 (UTC).
The worked example. Sample data invented for the illustration: 4 CRM customers, 7 invoices and 7 support tickets. The script loads them into an in-memory SQLite database and runs each check. Every figure in the example table comes from that run. It is illustrative, not measured on customer data.
Limits. We didn't test the five methods on the same dataset, so the method table compares documented limits, not measured performance. Limits change with product releases; check the cited page before you rely on one.
References
- Microsoft Learn, "Merge queries overview" (Power Query), last updated 9 Apr 2026. https://learn.microsoft.com/en-us/power-query/merge-queries-overview
- Google Cloud, "How blends work in Data Studio" (formerly Looker Studio), last updated 26 Oct 2026. https://docs.cloud.google.com/data-studio/how-blends-work
- Google Cloud, "Introduction to federated queries" (BigQuery), last updated 27 Oct 2026. https://docs.cloud.google.com/bigquery/docs/federated-queries-intro
- PostgreSQL Global Development Group, "postgres_fdw" (PostgreSQL 18 documentation), read 5 Nov 2026. https://www.postgresql.org/docs/current/postgres-fdw.html
- AWS, "Zero-ETL integrations" (Amazon Redshift Management Guide), read 5 Nov 2026. https://docs.aws.amazon.com/redshift/latest/mgmt/zero-etl-using.html
- DataFuseAI, "How to Get Insights From API Data: A No-Code Pipeline", 17 Jul 2026. https://www.datafuseai.com/blogs/api-data-to-insights
- DataFuseAI, "Multi-Source Data Conflicts: What To Do When Systems Disagree", 30 Apr 2026. https://www.datafuseai.com/blogs/multi-source-data-conflicts
- DataFuseAI, "Fuzzy Matching in ETL Pipelines: Algorithms & No-Code Implementation", 29 May 2026. https://www.datafuseai.com/blogs/fuzzy-matching-etl-pipelines
- DataFuseAI, "Zero-ETL Architecture Limitations: What Vendors Don't Say", 10 Mar 2026. https://www.datafuseai.com/blogs/zero-etl-architecture-limitations
- DataFuseAI, "Data connectors", read 5 Nov 2026. https://www.datafuseai.com/platform/data-connectors
- DataFuseAI, "Data integration platform" (solution page), read 5 Nov 2026. https://www.datafuseai.com/solutions/data-integration-platform
- DataFuseAI, "Batch vs CDC vs Streaming: A Leadership Decision Framework", 24 Aug 2026. https://www.datafuseai.com/blogs/batch-vs-cdc-vs-streaming
- Microsoft Support, "Merge queries (Power Query)" (Excel), read 5 and 6 Nov 2026. https://support.microsoft.com/en-us/office/merge-queries-power-query-fd157620-5470-4c0f-b132-7ca2616d17f9
- DataFuseAI, "Build vs Buy Data Pipeline: The Calculation Vendors Skip", 6 Apr 2026. https://www.datafuseai.com/blogs/build-vs-buy-data-pipeline
- Microsoft Learn, "Table.NestedJoin" (Power Query M), last updated 24 Mar 2026. https://learn.microsoft.com/en-us/powerquery-m/table-nestedjoin
- Microsoft Support, "XLOOKUP function" (Excel), read 6 Nov 2026. https://support.microsoft.com/excel/functions/xlookup-function
 Request a Demo